Surface Data Types and Customizations
AtomicusChart® processes a variety of surface data types and customizations for data visualization. These surface data types fall into three primary categories:
- Primitives and meshes
- Surface grids
- Raster data
All objects discussed are triangle-based objects, which means they consist of triangle vertexes, triangle list indexes, and normal vectors. Note: Clockwise orientation should be used when triangle indexes are defined.
Triangle-based objects (also referred to as a “triangle mesh”) are used in computer graphics to render data into 2D or, more commonly, 3D. AtomicusChart uses a list of isolated triangles with at least three vertices, known as a triangle list. Triangle lists are then used to visualize an object made up of disjointed pieces, which enables and simplifies further processing of the object. These triangle lists are very useful for creating primitives with sharp edges and shading.
All triangle surface-based data has different customizations for defining the render material for varying ambient, diffusion, and specular intensities as required.
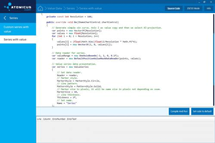
Below is a sample of code for simple mesh generation, which would be used in the examples referenced on this page:
private Vector3F[] GenSinSurface(int resolution)
{
	var func = new Func<float, float, float>((x, y) => (float)(Math.Sin(x) * Math.Sin(x * x + y * y)));

	float rangeMin = -3f, rangeMax = 3f;
	Vector3F[] result = new Vector3F[resolution * resolution];
	int index = 0;
	for (int y = 0; y < resolution; y++)
		for (int x = 0; x < resolution; x++)
		{
			var vx = rangeMin + (rangeMax - rangeMin) * x / (resolution - 1);
			var vy = rangeMin + (rangeMax - rangeMin) * y / (resolution - 1);
			result[index++] = new Vector3F(vx, vy, func(vx, vy));
		}
	return result;
}
Primitives and Meshes With AtomicusChart
AtomicusChart supports the most popular types of predefined primitive, including cube, tetrahedron, cone, cylinder, sphere, disk, line, semisphere, prism, arrow, tube, and surface primitive types. Users can also easily implement their own primitive type or shape predefined primitive types into more complex items, such as crystal structures or molecules. The user can display as many objects as needed or desired, with different colors, sizes, and transparencies for the different objects.
Custom primitives may be created using any of the following (optional) computations and matrixes:
- Surface mesh
- Geometry factory
- Transform matrix
Surface Mesh
AtomicusChart’s mesh type is the most basic type used for defining a surface mesh and creating primitive objects. The surface mesh consists of vertexes, triangle list indexes, normal vectors (defined per vertex), and wireframe line list indexes. Users are able to generate any complexity of mesh, and individual meshes can be collected and combined into one. Meshes can be used to reduce memory consumption and improve processing speed and efficiency. To create colored meshes, users can utilize a ColoredMesh type that applies color per vertex.
//First step is to define positions.
var positions = new []
{
	new Vector3F(0),
	new Vector3F(1,1,0),
	new Vector3F(0,1,0),

	new Vector3F(0,0,1),
	new Vector3F(1,1,1),
	new Vector3F(0,1,1),
};
//Next we define triangle list indexes.
var indexes = new[] { 0, 1, 2, 3, 4, 5 };

//Create triangle normals.
var normal1 = Vector3F.Cross(positions[0] - positions[1], positions[2] - positions[1]);
var normal2 = Vector3F.Cross(positions[3] - positions[4], positions[5] - positions[4]);
var normals = new [] { normal1, normal1, normal1, normal2, normal2, normal2 };

//Create mesh.
var mesh = new Mesh(positions, normals, indexes, indexes);

//Simple render data to present mesh.
var primitive = new Surface
{
	SurfaceMesh = mesh,
	Color = Colors.Blue
};

// Setup chart options.
chartControl.AxesSettings.Axes3D.IsVisible = true;
chartControl.View.Camera2D.Projection = Projection2DTypes.XPosYPos;

// Set data source.
chartControl.DataSource = primitive;

Geometry Factory
By calculating a set of geometric attributes, our Geometry Factory helps build geometric objects for the user. All predefined primitives are based on a Geometry Factory.
//Create mesh using geometry factory. For more examples see "AtomicusChart.Interface.GeometryFactory" namespace.
var mesh = AtomicusChart.Interface.GeometryFactory.TorusMeshFactory.GenerateTorus(200, 100, 5, 1);

//Simple render data to present mesh.
var primitive = new Surface
{
	SurfaceMesh = mesh,
	Color = Colors.Blue
};

// Setup chart options.
chartControl.AxesSettings.Axes3D.IsVisible = true;
chartControl.View.Camera2D.Projection = Projection2DTypes.XPosYPos;

// Set data source.
chartControl.DataSource = primitive;

Transform Matrix
Objects can be created in many ways, and the transform matrix is another option that is used to convert the object into the required shape. Transform matrix is applicable to surface grids and raster data. Each render data contains a transformation capability, along with a list of other helpful methods within the Matrix4D class.
primitive.Transform =
	Matrix4F.Scaling(1, 2, 1)
	* Matrix4F.RotationAxis(Vector3F.UnitX, Math.PI / 4)
	* Matrix4F.Translation(5, 1, 10);

To form the final shapes, several meshes can be transformed and concatenated into a single one:
var mesh = Mesh.Concat(new[]
{
	CubeMeshFactory.GenerateCube()
		.GetTransformed(Matrix4F.RotationAxis(Vector3F.UnitZ, Math.PI / 4) * Matrix4F.Translation(-1, 0, 0)),
	SphereMeshFactory.GetSphere(4)
		.GetTransformed(Matrix4F.Translation(1, 0, 0)),
	CylinderMeshFactory.CreateCylinder(200)
		.GetTransformed(Matrix4F.Scaling(0.5f, 0.5f, 1.5f) * Matrix4F.RotationAxis(Vector3F.UnitY, Math.PI / 2))
});

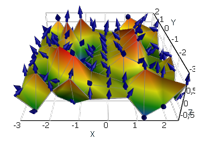
Primitives
A set of predefined primitive render data types uses the Geometry Factory and Transform Matrixes internally, where primitives are introduced to simplify the interface for creating popular shapes. Our predefined primitives allow the user to create popular shapes in one line of code, without any additional knowledge of matrixes or meshes.
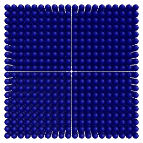
chartControl.DataSource = new[]
{
	new Arrow
	{
		//Resolution for radial part of item. Means number of generated points
		Resolution = 200,
		//Item direction vector
		Direction = Vector3F.UnitX,
		//Item position relatively base center
		Position = new Vector3F(0f, 0f, 0f),
		//Item total height
		Height = 2f,
		Color = Colors.Red,
		//Base height / cone height ratio
		BaseToConeHeightRatio = 1.5f,
		//Base radius / cone radius ratio
		BaseToConeRadiusRatio = 0.5f,
		//Name of the arrow
		Name = "Arrow 1"
	},
	new Arrow
	{
		//Resolution for radial part of item. Means number of generated points
		Resolution = 200,
		//Item direction vector
		Direction = Vector3F.UnitY,
		//Item position relatively base center
		Position = new Vector3F(0f, 0f, 0f),
		//Item total height
		Height = 2f,
		Color = Colors.Green,
		//Base height / cone height ratio
		BaseToConeHeightRatio = 1f,
		//Base radius / cone radius ratio
		BaseToConeRadiusRatio = 0.2f,
		//Name of the arrow
		Name = "Arrow 2"
	},
	new Arrow
	{
		//Resolution for radial part of item. Means number of generated points
		Resolution = 200,
		//Item direction vector
		Direction = Vector3F.UnitZ,
		//Item position relatively base center
		Position = new Vector3F(0f, 0f, 0f),
		//Item total height
		Height = 2f,
		//Item radius of maximal part (cone or base) depending on BaseToConeRadiusRatio property
		Radius = 0.1f,
		Color = Colors.Blue,
		//Base height / cone height ratio
		BaseToConeHeightRatio = 0.5f,
		//Base radius / cone radius ratio
		BaseToConeRadiusRatio = 0.5f,
		//Name of the arrow
		Name = "Arrow 3"
	},
	new Arrow
	{
		//Resolution for radial part of item. Means number of generated points
		Resolution = 200,
		//Item direction vector
		Direction = Vector3F.UnitZ,
		//Item position relatively base center
		Position = new Vector3F(0.5f),
		//Item total height
		Height = 0.5f,
		Radius = 0.4f,
		Color = Colors.Cyan,
		//Base height / cone height ratio
		BaseToConeHeightRatio = 0.3f,
		//Base radius / cone radius ratio
		BaseToConeRadiusRatio = 2f,
		//Name of the arrow
		Name = "Arrow 4"
	},
	new Arrow
	{
		//Resolution for radial part of item. Means number of generated points
		Resolution = 20,
		//Item direction vector
		Direction = Vector3F.UnitZ,
		//Item position relatively base center
		Position = new Vector3F(1.5f, 1.5f, 0f),
		//Item total height
		Height = 2f,
		//Item radius of maximal part (cone or base) depending on BaseToConeRadiusRatio property
		Radius = 0.1f,
		PresentationType = PrimitivePresentationType.Wireframe,
		Color = Colors.DarkBlue,
		//Base height / cone height ratio
		BaseToConeHeightRatio = 0.5f,
		//Base radius / cone radius ratio
		BaseToConeRadiusRatio = 0.5f,
		//Name of the arrow
		Name = "Arrow 5"
	},
};

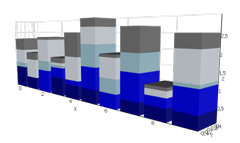
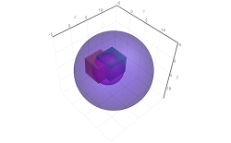
Collection and Composition
In order to improve performance, primitives with the same base mesh can be combined into a collection. Then, separate transformation matrixes can be defined per item, using object picking to identify each item in a collection separately.
Another method of composition involves using composite render data to combine several different objects in order to introduce common properties for the set of objects. Some of these properties include common visibility, name, item in the legend control, and a common transformation matrix.
const float distToLarge = 0.5f;
const float distToSmall = 1.0f;
const int resolution = 50;

var largeCenters = new Vector3F[6];
var smallCenters = new Vector3F[6];
// Create positions.
for (var i = 0; i < 6; i++)
{
	var cos = (float)Math.Cos(Math.PI / 3 * i);
	var sin = (float)Math.Sin(Math.PI / 3 * i);
	largeCenters[i] = new Vector3F(cos * distToLarge, sin * distToLarge, 0);
	smallCenters[i] = new Vector3F(cos * distToSmall, sin * distToSmall, 0);
}
// Show result.
chartControl.DataSource = new CompositeRenderData(new ObservableCollection<RenderData>()
{
	new SphereCollection(largeCenters.Select(Matrix4F.Translation).ToArray(), 0.57f, resolution)
	{
		Color = Colors.Purple,
		IsLegendVisible = false
	},
	new SphereCollection(smallCenters.Select(Matrix4F.Translation).ToArray(), 0.3f, resolution)
	{
		Color = Colors.Gold,
		IsLegendVisible = false
	}
});

Surface Grids With AtomicusChart
While primitives are based on immutable meshes, surface grids are based on the data reader’s approach. ColorMap supports additional value axis besides the traditional X, Y, and Z axis, and the value axis is colored using the color legend.
Surface grids are used for large data sets with up to 100 million points, depending on the graphical hardware used. However, most of the time surface grids are used for small data sets. To further improve performance, large data sets can be simplified using the built-in decimation algorithm, with some factor of error. Performance can be dramatically improved with almost the same look.
AtomicusChart supports irregular and structured types of grids.
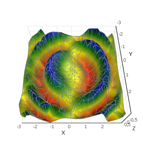
Irregular Surface Grids
For irregular, unstructured grids, the Delaunay 2D data triangulation algorithm is used to build the triangle grid for the X, Y space, since irregular grids don’t have structured points along the X or Y plane.
const int resolution = 50;
var positions = GenSinSurface(resolution);
var random = new Random();
positions = positions.Where(v => random.Next(3) == 1).ToArray();

var surface = new ValueSurface
{
	// Reader can be reused and we can create several presentations for 1 reader.
	// Note: this reader provider default implementation, so feel free to implement your own logic.
	Reader = new IrregularValueSurfaceDataReader(
		positions, // Define surface points.
		positions.Select(p => p.Z).ToArray(),// Surface values, here they are equal to Z values .
		2,
		new OneAxisBounds(-1, 1, 0, 0.1f)), //Value axis bounds.
											// Setup presentation option.
	PresentationType = ValueSurfacePresentationType.SolidAndWireframe,
	// Set name.
	Name = "Surface"
};


// Set data source.
chartControl.DataSource = surface;

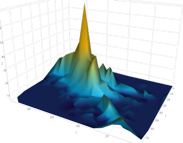
Structured Surface Grids
These types of grid maps are displayed as surfaces that are defined by the X, Y, and Z values as positioned in a structured grid, which can be viewed in different projections.
Users can further improve performance by using AtomicusChart data readers to easily update data by regions, from one point to a whole data set. This is very useful for the visualization of a long measurement process or other dynamic data.
const int resolution = 50;
var positions = GenSinSurface(resolution);
var surface = new ValueSurface
{
	// Reader can be reused and we can create several presentations for 1 reader.
	// Note: this reader provider default implementation, so feel free to implement your own logic.
	Reader = new StructuredValueSurfaceDataReader(
		positions, // Define surface points.
		positions.Select(p => p.Z).ToArray(),// Surface values, here they are equal to Z values .
		resolution, resolution,
		new OneAxisBounds(-1, 1, 0, 0.1f)), //Value axis bounds.
											// Setup presentation option.
	PresentationType = ValueSurfacePresentationType.SolidAndWireframe,
	// Set name.
	Name = "Surface"
};

// Set data source.
chartControl.DataSource = surface;


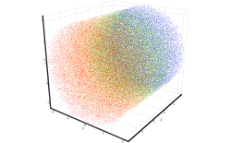
Raster Data With AtomicusChart
Raster data is very similar to structured grids, but differs in that it is defined only by regular (uniform) grids and has much faster performance (approximately 100 times faster). In order to draw raster data, the user should define some surface geometry with the relative raster data coordinates per vertex. Users are able to attach raster data to geometry — either a simple rectangle or a complex surface. A simple raster data rendering technique is used when colors are taken from the raster source.
Some normal map sources can be added as well, but raster data can only contain intensities or colors that are interpreted on the value axis and presented using a ColorMap. The options for techniques used to define raster data include:
- RGB: A basic technique where RGB color is defined for each data point.
// Create geometry.
var geometry = new RectTextureGeometry
{
	Origin = Vector3F.Zero,
	DirectionX = Vector3F.UnitX,
	DirectionY = Vector3F.UnitY,
	Size = new Vector2F(1f, 1f)
};

var rasterData = new RasterData
{
	// Linear interpolation.
	InterpolationType = RasterDataInterpolationType.Linear,
	//Create new reader from bitmap file. But also custom reader from user format can be used.
	Reader = new BitmapSourceRasterImage2DReader(new BitmapImage(new Uri(@"d:\IMG_0096.JPG"))),
	// Set geometry.
	Geometry = geometry,
	// Set name.
	Name = "Surface"
};

// Set chart data source.
chartControl.DataSource = rasterData;

const int resolution = 50;
// We take the same data as for surfaces for demo purposes, in current case it contains redundant x, y values.
Vector3F[] positions = GenSinSurface(resolution);

// Extract only values from z array.
float[] values = positions.Select(v => v.Z).ToArray();

// Create geometry.
var geometry = new RectTextureGeometry
{
	Origin = Vector3F.Zero,
	DirectionX = Vector3F.UnitX,
	DirectionY = Vector3F.UnitY,
	Size = new Vector2F(1f, 1f)
};

var rasterData = new ValueRasterData
{
	// Linear interpolation.
	InterpolationType = RasterDataInterpolationType.Linear,
	// Float data reader specification (values, data stride/width and value axis bounds).
	Reader = new FloatIntensityImage2DReader(values, resolution, new OneAxisBounds(-1f, 1f, 0, 0.1f)),
	// Set geometry.
	Geometry = geometry,
	// Set name.
	Name = "Surface"
};

// Set chart data source.
chartControl.DataSource = rasterData;

private class NormalReader : RasterImage2DReader
{
	private readonly byte[] convertedNormals;

	public NormalReader(int resolution, Vector3F[] normals) : base(resolution, resolution, RasterImage2DFormat.Bgr32, false)
	{
		convertedNormals = new byte[normals.Length * 4];
		int index = 0;
		for (int i = 0; i < normals.Length; i++)
		{
			var n = normals[i].GetNormalized();
			if (n.Z > 0)
				n = new Vector3F(-n.X, -n.Y, -n.Z);
			convertedNormals[index++] = (byte)((n.Z + 1) / 2 * 255);
			convertedNormals[index++] = (byte)((n.Y + 1) / 2 * 255);
			convertedNormals[index++] = (byte)((n.X + 1) / 2 * 255);
			convertedNormals[index++] = 0;
		}
	}

	public override void InitializeResource(IResourceWriter2D resourceWriter)
	{
		resourceWriter.UpdateResource(convertedNormals, Description.Width * 4);
	}
}
const int resolution = 200;
// We take the same data as for surfaces for demo purposes, in current case it contains redundant x, y values.
Vector3F[] positions = GenSinSurface(resolution);

// Extract only values from z array.
float[] values = positions.Select(v => v.Z).ToArray();

var normals = new Vector3F[resolution * resolution];
NormalProcessor.GetSmoothNormals(positions, GridHelper.GetStructuredTriangleListIndices(0, resolution, resolution, 1), normals);

// Create geometry.
var geometry = new RectTextureGeometry
{
	Origin = Vector3F.Zero,
	DirectionX = Vector3F.UnitX,
	DirectionY = Vector3F.UnitY,
	Size = new Vector2F(1f, 1f)
};

var rasterData = new ValueRasterData
{
	// Linear interpolation.
	InterpolationType = RasterDataInterpolationType.Linear,
	// Float data reader specification (values, data stride/width and value axis bounds).
	Reader = new FloatIntensityImage2DReader(values, resolution, new OneAxisBounds(-1f, 1f, 0, 0.1f)),
	BumpReader = new NormalReader(resolution, normals),
	// Set geometry.
	Geometry = geometry,
	// Set name.
	Name = "Surface"
};

// Set chart data source.
chartControl.DataSource = rasterData;

private class TexGeom : TextureGeometry
{
	private readonly TextureMesh mesh;

	public TexGeom(Vector3F[] vert, int resolution)
	{
		mesh = new TextureMesh(vert,
			vert.Select(v => new Vector2F((v.X + 3) / 6, (v.Y + 3) / 6)).ToArray(),
			GridHelper.GetStructuredTriangleListIndices(0, resolution, resolution, 1));
	}

	public override TextureMesh GetMesh() => mesh;
}
// Create geometry.
var rasterData = new RasterData
{
	// Linear interpolation.
	InterpolationType = RasterDataInterpolationType.Linear,
	//Create new reader from bitmap file. But also custom reader from user format can be used.
	Reader = new BitmapSourceRasterImage2DReader(new BitmapImage(new Uri(@"d:\IMG_0096.JPG"))),
	// Set geometry.
	Geometry = new TexGeom(GenSinSurface(100), 100),
	// Set name.
	Name = "Surface"
};

// Set chart data source.
chartControl.DataSource = rasterData;

InterpolationType = RasterDataInterpolationType.None
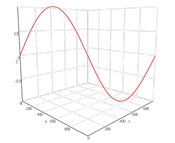
Contours Search With AtomicusChart
A contour line represents a curve along which the function has the same value. Depicting contour lines enables users to obtain more accurate and illustrative information about the analyzed quantity. The density of contour lines shows the rate of change in quantity: More closely spaced contours correspond to a steep variation.
After displaying a number of contours, users can identify regions with the required values of the considered quantity and then analyze those regions separately.
AtomicusChart provides an automatic search for contour lines. Users can specify the number of contours, the quantities at the contours, and their width and color. Users also have the ability to apply a user-defined algorithm for contours search that can be fully integrated into the component infrastructure and connected to its interface.
private class CustomContoursOwner : IContoursOwner
{
	public CustomContoursOwner(ObservableCollection<Contour> contours) => Contours = contours;

	public event PropertyChangedEventHandler PropertyChanged;

	public event PropertyChangingEventHandler PropertyChanging;

	public ObservableCollection<Contour> Contours { get; }
}
const int resolution = 500;
var positions = GenSinSurface(resolution);

// Create contours collection.
var contours = Enumerable.Range(0, 10).Select(i => new Contour(i/5f-1f, Colors.Blue, 2f));

// Create the surface data reader.
var reader = new StructuredValueSurfaceDataReader(
	positions, // Define surface points.
	positions.Select(p => p.Z).ToArray(), // Surface values, here they are equal to Z values .
	resolution, resolution,
	new OneAxisBounds(-1, 1, 0, 0.1f)); //Value axis bounds.

// Create the surface.
var surface = new ValueSurface
{
	// Reader can be reused and we can create several presentations for 1 reader.
	Reader = reader,
	// Setup presentation option.
	PresentationType = ValueSurfacePresentationType.Solid,
	// Set name.
	Name = "Surface"
};


// Create the data that is responsible for contour visualization.
var contoursData = new TriangleContoursRenderData
{
	// Set contours computer source.
	DataSource = reader,
	// Set contours collection source.
	ContoursSource = new CustomContoursOwner(new ObservableCollection<Contour>(contours)),
	// Set name.
	Name = "Contours",
};


// Set data source.
chartControl.DataSource = new RenderData[] { surface, contoursData };

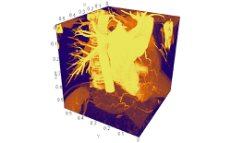
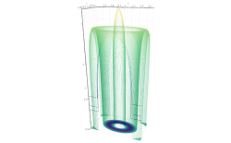
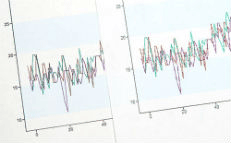
There is another set of examples illustrating Surface Grids supported by AtomicusChart.
|
|
|
|
|---|---|---|

|

|

|
|
|
|
|

|

|

|