AtomicusChart®: a WPF Chart From Atomicus
AtomicusChart® is a WPF Chart from Atomicus that’s intended for analytical applications. It can be reused and integrated into any software that requires high-speed graphics for large volumes of data, including large data.
As a collection of libraries and modules, AtomicusChart® is capable of:
- Visualizing 1D, 2D, 3D, and 4D data with numerous options for representation
- Handling large data volumes and high-speed data processing
AtomicusChart® is a DirectX 11-based 1D/2D/3D/4D graphical .NET control. It was designed and optimized for the needs of analytical software in high-tech scientific, industrial, and commercial applications. AtomicusChart® is a best-in-class software for data visualization, and is best for any application that requires fast, real-time, or large data display charts.
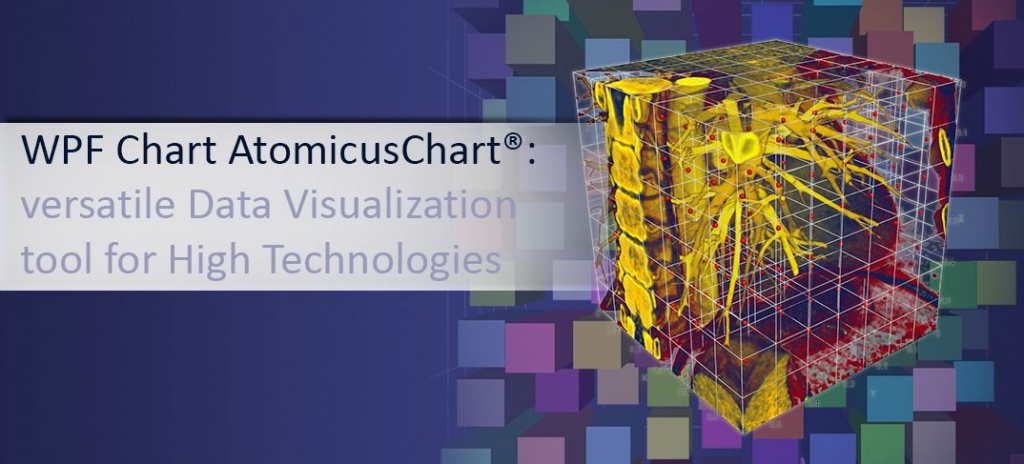
The solution was designed as a versatile data visualization tool for high technologies, complete with 4D representation, 3D rendering and interaction, and substantial capabilities for 2D plotting. AtomicusChart® is the state-of-the-art tool for manipulating and displaying data for communication and analysis.
How It Works
AtomicusChart® fully stores data in its video memory, and data processing is accomplished using a GPU shader program. Operations such as switching linear/SQRT/LOG scale or changing the ColorMap are nearly instantaneous.
Data rendering is extremely fast with AtomicusChart®, pulling together millions of data points into a variety of different chart types and visualization options. AtomicusChart® also provides a highly responsive and intuitive user experience.
Every data visualization can be viewed in 2D, 3D, and 4D. The 2D view is just a special case of the 3D view that utilizes parallel projection, a simplified light model, and camera movement limitations. Customers may select any of the 24 projections available. GPU-based ray casting with shading is used for rendering volumetric data.
Advantages of AtomicusChart®
AtomicusChart® offers custom features for WPF Charts that can be seamlessly integrated with large data software applications to make your charts more powerful and accessible than ever before. Hundreds of features are already built out.
Order-Independent TransparencyKeep track of all your information in a visually stunning way with AtomicusChart® ’s unique order-independent transparency. To avoid having to sort all visible translucent objects by their depth value, we created this algorithm to maintain pixel opacity across entire objects, enabling more accurate data visualization. |
Auto-Scaling LabelsWith AtomicusChart® , every label you apply will auto-face and auto-scale. Change your chart, add information to your array, and create new labels in the simplest way possible. |
High-Resolution Image ExportingAtomicusChart® image exporting is done at a higher resolution than other WPF Charts, giving you the clearest representation of your data. |
Raster Data With ColoringGoing beyond regular rasters, AtomicusChart® users can present raster data on complex surfaces, bringing your data visualization to a whole new level. Rasters can also be colorized with a ColorMap. |
Complete X, Y, Z Aspect Ration ControlX, Y, Z aspect ratio control makes it easier to control the proportions of width, length, and height on your chart. Better ratio control maintains visualized data as the size of the chart changes, ensuring that no data is lost or misrepresented. All axes are fully customizable. |
Structured, Regular, and Irregular Grid SurfacesAtomicusChart® supports structured, regular, and irregular grid surfaces, increasing the possibilities of data visualization on 2D, 3D, and 4D surfaces. |
Ability to Quickly Switch Between 2D and 3D ViewsChoose from 24 3D projections of your visualized object, and instantly switch between 2D and 3D visualizations, both of which are supported by AtomicusChart®. |
Volume RenderingRender any level of your data with GPU ray casting, customize the transfer functions, set your color legends, and display multiple objects — all in real time in a 2D or 3D field. |
Industry Applications for AtomicusChart®
AtomicusChart® is a customizable, state-of-the-art data visualization tool for the most demanding industries, from science to medical analysis and reporting. The chart provides unmatched performance in real-time data acquisition and visualization, using its high-speed professional software for scientific renderings.
The control was designed and optimized for the needs of highly technological scientific and industrial applications, with best-in-class analytical renderings in a wide range of chart types. Some of the top industries that use AtomicusChart® include:
- Financial, Stock, & Trading: In a live trading market, application reliability and speed are critical for success, and delays or downtime may have distressing consequences. AtomicusChart® has a proven record of performance in charting, ensuring smooth function and speedy renderings — even with millions of data points.
- Medical & Scientific: AtomicusChart® is commonly used in medical and scientific applications, where millions of data points must be reviewed simultaneously. Our solution integrates data points into a variety of different chart types and visualization options for the varying needs of these complex industries.
- Engineering & Design: With 3D and 4D rendering capabilities, AtomicusChart® is the premier platform for high-end data visualization in engineering and design applications. It supports streamlined data acquisition and analysis with rapidly issued renderings that clearly define their data points into visually engaging and representative models.
AtomicusChart® also supports data visualization with industry-specific features such as:
Competitive Advantage: AtomicusChart® also provides reliable and accurate processing of large data sets — as many as 40 million data points — for video adapters with mid-range video cards without reducing the data prior to processing like the competition often does.
Principal Features of WPF AtomicusChart®
AtomicusChart® has an array of high-end features for WPF Charts, some of which are only available with our integrated technology. With AtomicusChart®, you’ll be able to generate arrays, charts, and visualizations.
- High performance and optimization for large data sets
- 40,000,000+ point clouds and 1,000,000 point curves
- 16 Mp structured grid 3D maps, 512x512x512 volumetric data, and 150 Mp+ raster data rendered with 30+ frames per second on average discrete video adapters
- 2x/4x/8x multisampling antialiasing and 2x supersampling antialiasing
- GPU-based order-independent transparency
- High-resolution image exporting for reports and printing
- Ambient/diffuse/specular light model and lit sphere support for materials emulation
- Axis coloring, tick count and adjustable density, and font selection
- Customizable series color, width, markers, and style
- Normal mapping, color mapping, and solid, wireframe graph, and waterfall plot
- Control over camera field of view, projection, and aspect ratio
- NaN / infinity / out of range handling
- Cartesian, cylindrical, and spherical coordinate systems
- Linear, logarithmic, and SQRT data scaling
- Fast data picking and integrated item interaction
- Built-in contours search
- Ability to extend render data types from outside and add additional info to your chart
Demonstration Videos
| Basic Types: Primitives | |
|
AtomicusChart® displays data in a wide variety of visualization structures:
These primitive types can be composed into more complex items, such as axes and different crystal structures or molecules (Benzene, InSb, Nanotube, etc.). Display as many items as you need in different colors, opacities, and sizes — including translucent objects. |
|
| Custom Features | |
|
AtomicusChart® offers custom features in 2D and 3D modes. One of them is cartesian or cylindrical (with XY and XZ projections), or spherical coordinate systems. The chart supports GPU-based data scaling and scale switch almost instantly (even for very large data sets). These scales are linear, sqrt (square-root), or logarithmic. Data scales can be applied to different axes simultaneously. The user can compose items with different materials, and intensity can be smoothly changed. Customize light positions for different components. AtomicusChart® has several light and material customization capabilities:
AtomicusChart® has its own contours search engine, in which the user can easily manage contours for surface data types, using both the user interface and code. For complex, transparent objects, AtomicusChart® supports GPU-based, per-pixel order-independent transparency. AtomicusChart® has high performance and optimization for large data sets, including 10 million-plus point clouds, 1 million point curves, 16 megapixel structured grid 3D maps, 512x512x512 volumetric data, and 150 megapixel-plus raster, which are rendered with 30+ frames per second on an average discrete video adapter. You can synchronize views for different chart controls independently using the built-in mechanism. |
|
| Data Types | |
|
AtomicusChart® has two primary data types: series and structured grid maps:
|
|
| Basic Types of Textures | |
|
With AtomicusChart® renderings, the user can use a simple raster mapping technique, or they can use raster data with a normal mapping technique, where image volume is emulated using normal maps. Raster data can be colorized using a ColorMap, and the user can create more complex surfaces for raster data, with up to 100+ megapixel raster images (e.g., for highly detailed visual renderings of planetary data). |
|
| GPU-Based Volume Rendering | |
|
AtomicusChart® supports real-time GPU-based ray casting and volume rendering techniques. With volume sections, the user can define any level of section surface complexity. For volume rendering, you can customize transfer functions and the color legend for volumes (color mapping). Available volume rendering techniques include:
These primitive types can be composed into more complex items, such as axes and different crystal structures or molecules (Benzene, InSb, Nanotube, etc.). Display as many items as you need in different colors, opacities, and sizes — including translucent objects. |
|
WPF Chart Integrations and Compatibility
The target PC for the AtomicusChart® control is a Windows 7/8/10-based system with DirectX 11 support and a .Net Framework 4.7. Keep in mind that:
- AtomicusChart® only runs on desktop PCs with Windows 7 or more recent operating systems.
- AtomicusChart® control should be integrated on a Microsoft .Net-based framework (not Java, Qt, or Python).
- Video adapters must support DirectX11 in order to run AtomicusChart®.
- Users who have specific requirements — such as compatibility with additional operating systems or frameworks — can order a customized version of AtomicusChart®.
AtomicusChart® is developed to work well even on low-end video adapters, such as CPU-integrated Intel Graphics. However, it can also be customized for high-end graphical adapters, which may improve performance.
with large data visualization.