 Lines Lines |
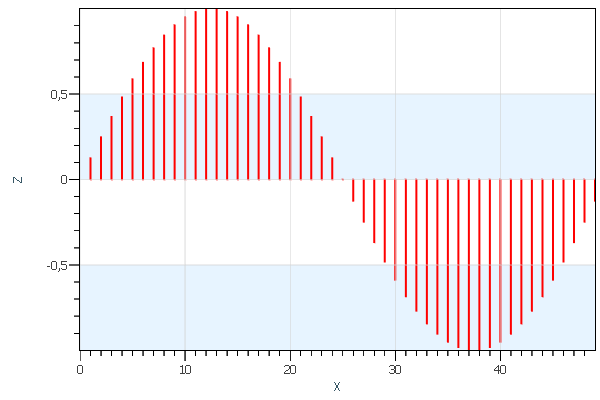 Spikes Spikes |
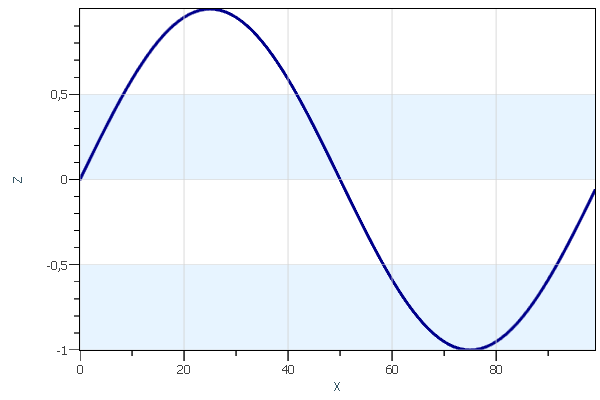
 Series Series |
 Error bars Error bars |
 Error bars Error bars |
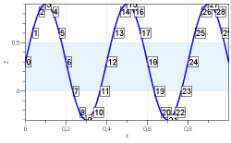
 Series with values Series with values |
 Filled series Filled series |
 Spikes with markers Spikes with markers |
 Collections Collections |
 Waterfall Waterfall |
A certain set of render data types will help you visualize data points as curves, spikes, error bars, and so on.
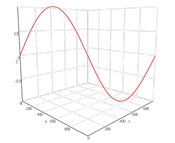
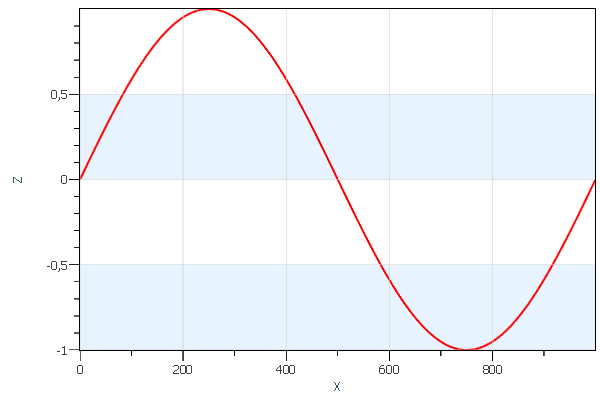
Lines
The simplest render data type that AtomicusChart® provides is the line. All the user has to do is define a vertex array and topology. Below is an example of the line render data type:
const int count = 1000;
//Generation of sample data.
var sampleData = Enumerable.Range(0, count)
	.Select(x => new Vector3F(x, x, (float)Math.Sin(x * Math.PI * 2 / count)))
	.ToArray();

//Make data fitted to cube as we have originally 1000:1 data aspect ratio
ChartControl.View.Camera3D.AspectRatio = new AspectRatio(PreferableAxis.X, new Vector3<float?>(1f));

//Add simple line type
ChartControl.DataSource = new Line
{
	Points = sampleData,
	Thickness = 2f,
	//Points will be connected one by one.
	Strip = true,
};
AtomicusChart® allows users to represent spike plots in the same way. Just change the topology and add intermediate points:
const int count = 100;
//Generation of sample data.
var sampleData = Enumerable.Range(0, count)
	.Select(x =>
	x % 2 == 0
	? new Vector3F(x / 2, x / 2, (float)Math.Sin(x / 2 * Math.PI * 4 / count))
	: new Vector3F(x / 2, x / 2, 0))
	.ToArray();

//Make data fitted to cube as we have originally 1000:1 data aspect ratio
ChartControl.View.Camera3D.AspectRatio = new AspectRatio(PreferableAxis.X, new Vector3<float?>(1f));

//Add simple line type
ChartControl.DataSource = new Line
{
	Points = sampleData,
	Thickness = 2f,
	//Points will be connected by pairs.
	Strip = false,
};
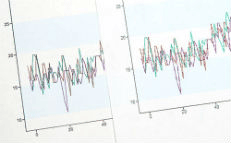
Series
Series is a more complex and advanced data type. It can be used in the same way as lines, but is much more functional and offers the following advantages:
- Support for the DataReader approach, which helps users work with large data and enables fast partial updates of data
- Displaying line markers
- Displaying line patterns
- Vertex masks that help to work with NaN and infinity values in the source data and those produced during scale (Log and Sqrt) operations (NaN and infinity values can be displayed in a special way on the plot.)
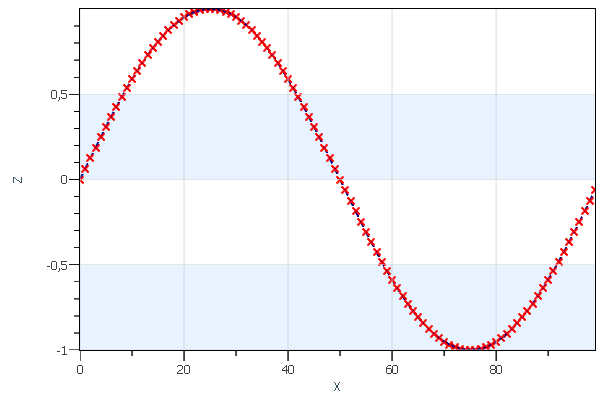
Here is the same data example using the series render data type:
const int count = 100;
//Generation of sample data.
var sampleData = Enumerable.Range(0, count)
	.Select(x => new Vector3F(x, x, (float)Math.Sin(x * Math.PI * 2 / count)))
	.ToArray();

// Setup chart control view settings.
ChartControl.View.Camera2D.Projection = Projection2DTypes.XPosZPos;
ChartControl.View.Mode2D = true;

// Create series data reader.
var reader = new DefaultPositionMaskDataReader(sampleData);

// Create series render data.
var series = new Series
{
	// Set name.
	Name = "Series",
	// Set color.
	Color = Colors.DarkBlue,
	// Set thickness.
	Thickness = 3,
	// Set pattern style.
	PatternStyle = PatternStyle.Solid,
	// Set data reader.
	Reader = reader,
	// Disable marker.
	MarkerStyle = MarkerStyle.None,
};

ChartControl.DataSource = new RenderData[] { series };
Error Bars
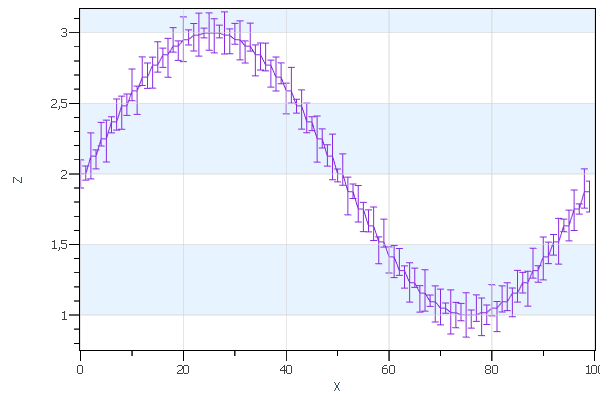
An error bar is a line through a point on a graph parallel to one of the axes, and represents the uncertainty of the measurement.
Error bars allow users to visualize the estimated measurement errors and show its reliability (how precise the measurement is). This is achieved by plotting the markers (bars) over the main data points, with their lengths corresponding to the deviation values.
Error bars represent how the data spreads around the mean value, and the reliability of the mean value is a representative number for the data set.
const int count = 100;
//Generation of sample data.
var sampleData = Enumerable.Range(0, count)
	.Select(x => new ErrorPoint(
			new Vector3F(x, 0, 2 + (float)Math.Sin(x / 2 * Math.PI * 4 / count)) ,
			(float)Math.Sin(x * 21) / 15 - 0.1f,
			(float)Math.Sin(x * 29) / 15 + 0.1f))
	.ToArray();

// Setup chart control view settings.
ChartControl.View.Camera2D.Projection = Projection2DTypes.XPosZPos;
ChartControl.View.Mode2D = true;


// Create error bar render data.
var errorBars = new ErrorBars
{
	// Set data.
	Data = sampleData,
	// Set color.
	Color = Colors.BlueViolet,
	// Set bar types.
	ErrorPresentaionType = ErrorPresentaionType.Bars,
	// Set type.
	Name = "Errors",
};

ChartControl.DataSource = errorBars;
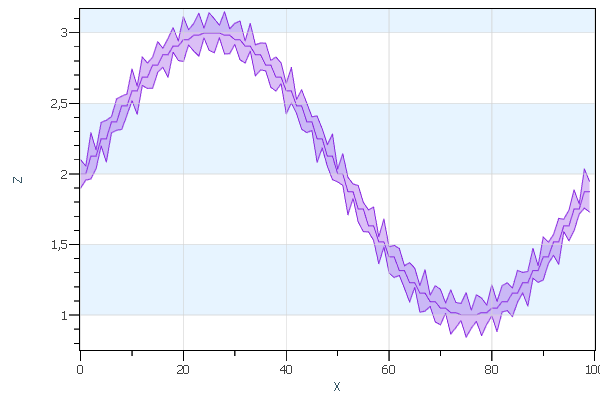
Below is another visualization option for error bars:
ErrorPresentaionType = ErrorPresentaionType.Stripes;
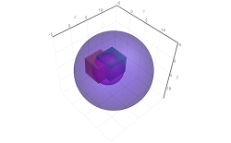
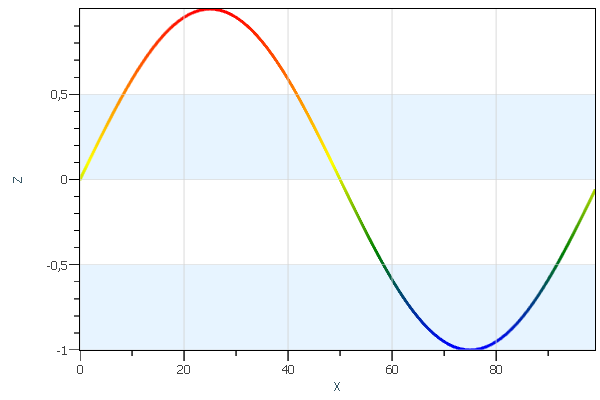
4D Series
The 4D series data type is an extension of the series data type; it includes a value axis that allows users to obtain a customizable ColorMap.
const int count = 100;
//Generation of sample data.
var sampleData = Enumerable.Range(0, count)
	.Select(x => new Vector3F(x, x, (float)Math.Sin(x * Math.PI * 2 / count)))
	.ToArray();

// Setup chart control view settings.
ChartControl.View.Camera2D.Projection = Projection2DTypes.XPosZPos;
ChartControl.View.Mode2D = true;

// Create series data reader.
var reader = new DefaultPositionValueMaskDataReader(sampleData,
	sampleData.Select(v=>v.Z).ToArray(), new OneAxisBounds(-1, +1));

// Create series render data.
var series = new ValueSeries
{
	// Set name.
	Name = "Series",
	// Set thickness.
	Thickness = 3,
	// Set pattern style.
	PatternStyle = PatternStyle.Solid,
	// Set data reader.
	Reader = reader,
	// Disable marker.
	MarkerStyle = MarkerStyle.None,
};

ChartControl.DataSource = new RenderData[] { series };
More Customization
Using AtomicusChart® controls, users can easily extend the supported data types with additional visual styles.
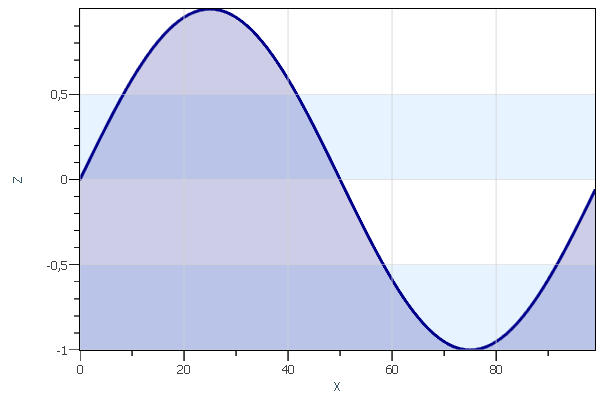
Filled Series
In the series data type, users can fill the area between any set value and the line with color.
const int count = 100;
//Generation of sample data.
var sampleData = Enumerable.Range(0, count)
	.Select(x => new Vector3F(x, x, (float)Math.Sin(x * Math.PI * 2 / count)))
	.ToArray();

// Setup chart control view settings.
ChartControl.View.Camera2D.Projection = Projection2DTypes.XPosZPos;
ChartControl.View.Mode2D = true;

// Create series data reader.
var reader = new DefaultPositionMaskDataReader(sampleData);

// Create series render data.
var series = new Series
{
	// Set name.
	Name = "Series",
	// Set color.
	Color = Colors.DarkBlue,
	// Set thickness.
	Thickness = 3,
	// Set pattern style.
	PatternStyle = PatternStyle.Solid,
	// Set data reader.
	Reader = reader,
	// Disable marker.
	MarkerStyle = MarkerStyle.None,
};

var fillData = new Vector3F[sampleData.Length * 2];
int index = 0;
for (int i = 0; i < sampleData.Length; i++)
{
	var p = sampleData[i];
	fillData[index++] = p;
	p.Z = -1;
	fillData[index++] = p;
}
var fillMesh = new Mesh(fillData, new Vector3F[fillData.Length], GridHelper.GetStructuredTriangleListIndices(0, 2, sampleData.Length, 1), new int[fillData.Length]);
var fillSurface = new Surface { SurfaceMesh = fillMesh, Color = new Color4(Colors.DarkBlue, 50) };

ChartControl.DataSource = new RenderData[] { series, fillSurface };
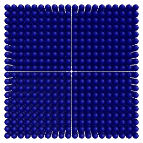
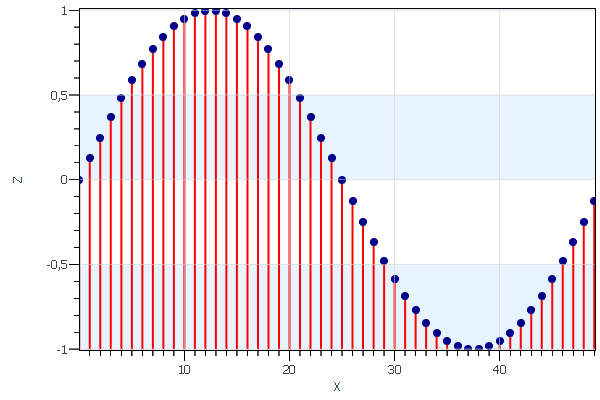
Spikes With Markers
A spike is a vertical line that extends from the plot point to the spike base (often the X axis). Users can choose to draw the spikes as solid, dashed, or spotted lines. Markers will appear at the plot points.
const int count = 100;
//Generation of sample data.
var sampleData = Enumerable.Range(0, count)
	.Select(x =>
		x % 2 == 0
			? new Vector3F(x / 2, x / 2, (float)Math.Sin(x / 2 * Math.PI * 4 / count))
			: new Vector3F(x / 2, x / 2, -1))
	.ToArray();

//Make data fitted to cube as we have originally 1000:1 data aspect ratio
ChartControl.View.Camera3D.AspectRatio = new AspectRatio(PreferableAxis.X, new Vector3<float?>(1f));

//Add simple line type
var line = new Line
{
	Points = sampleData,
	Thickness = 2f,
	//Points will be connected by pairs.
	Strip = false,
};

// Create series data reader.
var reader = new DefaultPositionMaskDataReader(sampleData.ToList().Where((c, i) => i % 2 == 0).ToArray());

// Create series render data.
var series = new Series
{
	// Set name.
	Name = "Series",
	// Set color.
	MarkerColor = Colors.DarkBlue,
	// Invisible line.
	Thickness = 0,
	// Set pattern style.
	PatternStyle = PatternStyle.Solid,
	// Set data reader.
	Reader = reader,
	// Circle marker.
	MarkerStyle = MarkerStyle.Circle
};

ChartControl.DataSource = new RenderData[] { line, series };
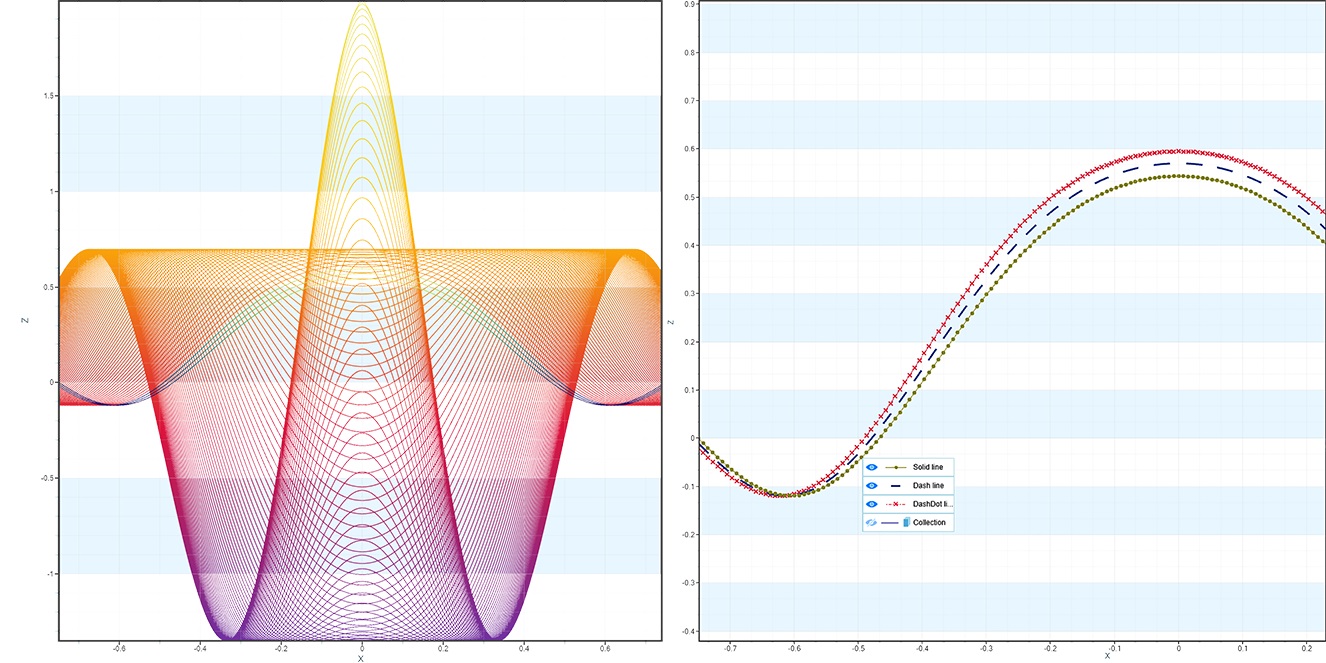
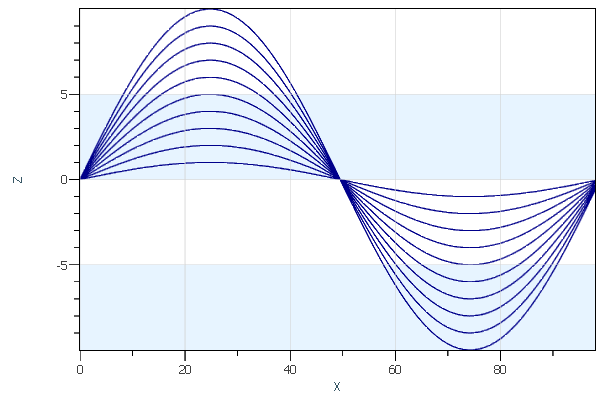
Series Collection
AtomicusChart® allows users to combine sets of series into a collection, which improves performance and makes the property changes easier.
const int count = 100;

var sampleData = new Vector3F[10 * count];
for (int y = 0; y < 10; y++)
	for (int x = 0; x < count; x++)
		sampleData[y * count + x] =
			x == count - 1
			? new Vector3F(float.NaN)
			: new Vector3F(x, y, (float)Math.Sin(x * Math.PI * 2 / (count - 1)) * (y + 1));

// Setup chart control view settings.
ChartControl.View.Camera2D.Projection = Projection2DTypes.XPosZPos;
ChartControl.View.Mode2D = true;

// Create series data reader.
var reader = new DefaultPositionMaskDataReader(sampleData);

// Create series render data.
var series = new Series
{
	// Set color.
	Color = Colors.DarkBlue,
	// Set thickness.
	Thickness = 1,
	// Set pattern style.
	PatternStyle = PatternStyle.Solid,
	// Set data reader.
	Reader = reader,
	// Disable marker.
	MarkerStyle = MarkerStyle.None,
};

ChartControl.DataSource = new RenderData[] { series };
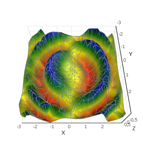
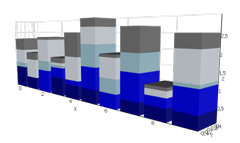
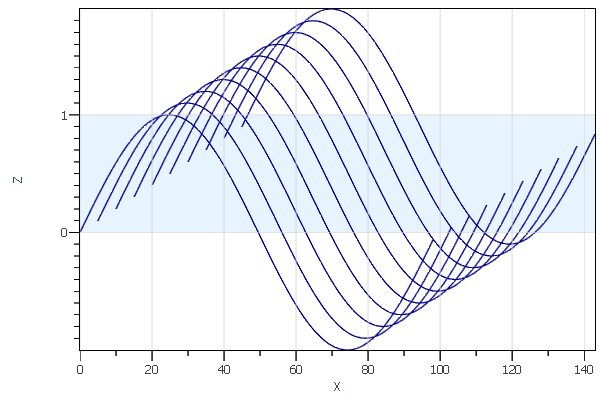
Waterfall View
AtomicusChart® allows users to display data in a waterfall view. A waterfall plot contains several curves displayed simultaneously, where each curve has an offset from the previous one in both X and Y directions, thus creating a waterfall effect. The waterfall plot is often used to show how two-dimensional information changes over time. A special transform matrix should be defined for the collection:
//Waterfall view
Transform = GetMatrix(100, 2, 10, 0.1f, 0.1f)

public static Matrix4F GetMatrix(float xRange, float zRange, float yRange, float xOffset, float zOffset)
{
	var z = zOffset * zRange / yRange * 5;
	var x = xOffset * xRange / yRange * 5;
	return
		new Matrix4F(
			1, 0, 0, 0,
			x, 1, z, 0,
			0, 0, 1, 0,
			0, 0, 0, 1
		);
}
Other Examples