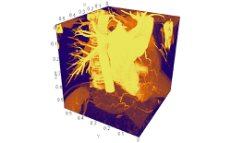
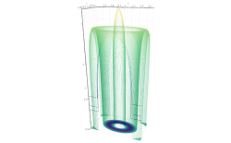
Main data type
Volume rendering features
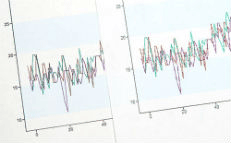
Basic types
Why AtomicusChart®?

Obtain a unique interpretation of complex data using both physical and mathematical measurements.

Interpret large data precisely and efficiently with a number of complex techniques.

AtomicusChart® is fast and productive even on low-end video adapters, including CPU integrated Intel Graphics.

We’ll solve any problems you encounter quickly and competently, and will always get back to you within 24 hours.
More Features:
Support:
We are always here to help you within 24 hours. We value your time and are ready to solve your problems quickly and competently.
Our qualified technical specialists are ready to address our users' questions. Depending on the request type, our specialists will either resolve issues themselves or submit them to the product developers.
-
We address user-submitted issues in the following ways:
- Clarification of account information and problem detailing
- Providing users with additional information, such as FAQs
- Forwarding issues to the development department in particularly complex cases
Whatever your question, we'll find the solution!