Large Data Arrays With AtomicusChart®
Atomicus has over 20 years of experience in analytical data visualization, and we’ve implemented all of the best practices we’ve learned into our AtomicusChart® control.
Avoid Redundant Data Processing and Rendering
We are very accurate with all redundant processing, so calculations such as updates to camera parameter, data bounds, and video memory occur automatically and only the minimum number of times. The same is true for scene rendering.
Here’s a very simple example of this approach:
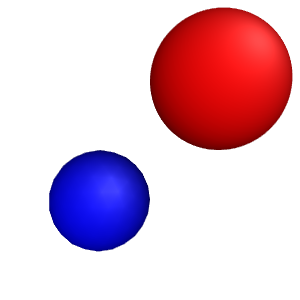
Sphere.Resolution = 20;
A change of that sphere object property will cause a series of automatic updates: a video memory update, global scene bounds updates, and a final image repaint. Now let’s consider the next code example, which is a fairly typical use of the control:
Sphere1.Resolution = 10; Sphere1.Resolution = 20; Sphere1.Resolution = 30; Sphere2.Resolution = 200; |
|
Most graphical controls make four updates for buffers, four updates for bounds, and four repaints. But our chart control makes only one update for “Sphere1” buffer, one update for “Sphere2” buffer, and one repaint for everything. All the updates are done automatically without any additional method calls on the user side.
Transforms, Data Sharing, and Collections
Transforms
AtomicusChart® also helps avoid additional video memory buffer updates. We introduce public transformation matrices for each render data, enabling the user to change data presentation parameters without additional memory movements. Rich vertices and matrices math is already included in AtomicusChart®, so it becomes very easy to work with. All chart data interaction is based on matrices; data movement/rotation/scale is just an adaptation of the data transformation matrix, which is a nearly instant operation. Many interactive AtomicusChart® tools work in the same way.
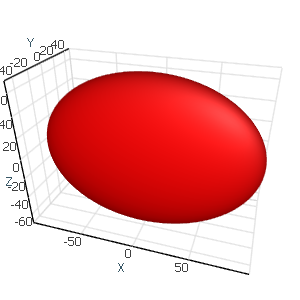
For example, you need a 3D ellipse with a radius of 100 along the X axis, 50 along the y axis, and 70 along the Z axis.
| Transforms sample | |
|---|---|
ChartControl.DataSource = new Sphere { Radius = 100, Transform = Matrix4F.Scaling(1f, 0.5f, 0.7f) }; |
|
Data Sharing
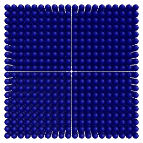
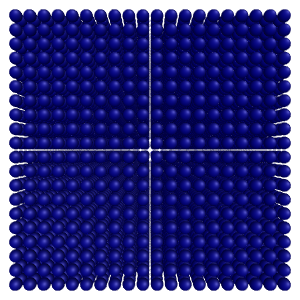
Transformation matrices are good for interactive objects, but AtomicusChart® goes even further than that. A typical visualization task may be to display a complex scene with hundreds of repeating geometries. You might have a custom object such as a sphere that you want to display multiple times with different parameters. The most common solution is as follows:
| Common solution: | |
|---|---|
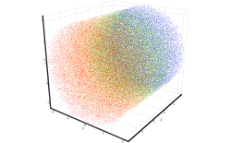
var data = new List<Sphere>(); for (int x = 0; x < size; x++) for (int y = 0; y < size; y++) for (int z = 0; z < size; z++) { var sphere = new Sphere { Position = new Vector3F(x, y, z), Radius = 0.45f, Color = Colors.DarkBlue, IsLegendVisible = false, IsHitTestVisible = false, Resolution = 100, Name = "Item " + z * 9 + y * 3 + x }; data.Add(sphere); } ChartControl.DataSource = data; |
|
|
Results: Data initialization time: 12 000 ms Video memory used: 1340 Mb Rendering performance: 13.2 FPS | |
But in AtomicusChart®, this can be performed in the following way:
| Shared data solution: | |
|---|---|
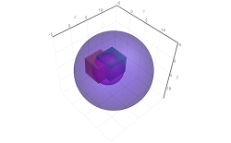
var myMesh = SphereMeshFactory.GetSphere(SphereMeshFactory.ResolutionToIterations(10)); var dataShared = new List<MyMesh>(); for (int x = 0; x < size; x++) for (int y = 0; y < size; y++) for (int z = 0; z < size; z++) { var mesh = new MyMesh(myMesh) { Transform = Matrix4F.Scaling(0.9f) * Matrix4F.Translation(x, y, z), Color = Colors.DarkBlue, IsLegendVisible = false, IsHitTestVisible = false, Name = "Item " + z * 9 + y * 3 + x }; dataShared.Add(mesh); } ChartControl.DataSource = dataShared; |
|
|
Results: Data initialization time: 500 ms Video memory used: 12 Mb Rendering performance: 113 FPS | |
All shapes have the same reference to a single mesh object; and for our chart, that means that only one object and 100 transformation matrices will be created in the video memory. This leads to high video memory saving and extremely fast data initialization type. This approach is even more relevant for large data that you would like to display using different rendering techniques. The same geometry object can be used for several raster data, and a single volumetric data array can be used for different visualizations, such as sections, maximum intensity projection, minimum intensity projection, ray casting, iso levels, and so on.
Collections
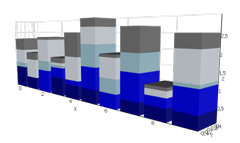
For simple geometry objects where the vertex count is lower than the number of GPU cores, performance has a known rendering issue. For example, 10,000 cubes can cause very poor performance. The most popular approach is to concatenate cube geometries into single geometry. This solution will significantly improve rendering performance, but not initialization performance. For such cases, AtomicusChart® provides special data types called collections. This approach presupposes the use of single video memory buffering containing vertices from one item only and performance on the level of concatenated geometry. Both initialization and rendering performance time are great in collections. It’s a basic type that should be used for complex crystal structures that display a large amount of similar geometries. Also, users are able to change properties for the whole collection, and such items are displayed as a single item in the chart legend.
| Collection solution: | |
|---|---|
var myMesh = SphereMeshFactory.GetSphere(SphereMeshFactory.ResolutionToIterations(10)); var transforms = new Matrix4F[size * size * size]; int index = 0; for (int x = 0; x < size; x++) for (int y = 0; y < size; y++) for (int z = 0; z < size; z++) { transforms[index++] = Matrix4F.Scaling(0.9f) * Matrix4F.Translation(x, y, z); } ChartControl.DataSource = new SingleColorPrimitiveCollection(transforms) { Color = Colors.DarkBlue, Mesh = myMesh, IsHitTestVisible = false, IsLegendVisible = false }; |
|
|
Results: Data initialization time: 29 ms Video memory used: 9 Mb Rendering performance: 342 FPS | |
Global Memory Sharing
Performance and memory consumption don’t change when data is displayed in a single chart window or in a separate one. All GPU memory-sharing features apply to the entire application. The same data displayed in 10 charts does not require any additional GPU memory. Users can create different views for the same data in different projection and chart modes, using different techniques simultaneously without additional initialization time and video memory consumption.
DataReaders Approach
The next common large data visualization issue is mismatching input data formatting. Here are several examples:
- Volumetric data can be stored in the array of slices that is represented in byte[][], in common single array byte[], or in byte[,,].
- Raster data can be stored as a bitmap, an array of colors (RGB, RGBA, ARGB, HSL), a two-dimensional array of intensities, and so on.
- Structured grid data can be presented by xStart, xStep, yStart, yStep, or Value[].
Additional common input formats for charting tools are:
- Byte[]: array containing all data
- Bitmap: bitmap for all data
- Vector[]: array containing all data
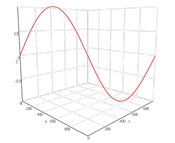
It’s easy to convert any other formats to these in just a few lines of code. However, that would be a bad idea for large data. Behind these lines of code are highly resource-consuming operations such as large memory allocations, LOH objects creation, and memory fragmentation. That’s why AtomicusChart® uses the DataReaders concept. Our render data types use simple DataReaders that are universal input format converters. Using DataReaders, users are able to reduce allocations to one slice, row, or element, and can even use pointers to memory as an option. No internal chart storage is used; data from the reader is directly transmitted into video memory.
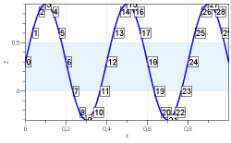
| Common solution: | |
|---|---|
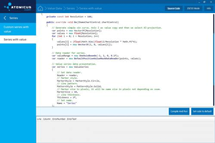
// Generate simple sin curve. Axis Z as value copy and then we select XZ-projection. var points = new Vector3F[Resolution]; for (int i = 0; i < Resolution; i++) { points[i] = new Vector3F(i, 0, (float)Math.Sin((float)i / Resolution * Math.PI * 4)); } // Data reader for series. var reader = new DefaultPositionMaskDataReader(points); // Value series data presentation. var series = new Series { Reader = reader, Thickness = 1f, Name = "Series" }; // We set XZ projection for 2D mode as we use Z axis same as value, and Y axis does not has sense ChartControl.View.Camera2D.Projection = Projection2DTypes.XPosZPos; ChartControl.View.Mode2D = true; // Set chart data source. ChartControl.DataSource = series; |
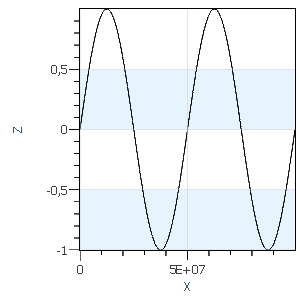
|
|
Results: System memory used: 1150 Mb | |
| Custom reader solution: | |
|---|---|
private class MyReader : PositionMaskDataReader { private readonly float xStart; private readonly float xStep; private readonly float[] values; private readonly int count; public MyReader(float xStart, float xStep, float[] values) : base(values.Length) { this.xStart = xStart; this.xStep = xStep; this.values = values; this.count = values.Length; } public override void InitializeResources(IResourceWriter1D positionsWriter, IResourceWriter1D masksWriter) { const int bufferSize = 10_000; Vector3F[] buffer = new Vector3F[bufferSize]; for (int i = 0; i < count / bufferSize; i++) { for (int x = 0; x < bufferSize; x++) buffer[x] = new Vector3F(xStart + xStep * (x + bufferSize * i), 0, values[x + bufferSize * i]); positionsWriter.UpdateResource(buffer, 0, bufferSize, bufferSize * i); } } } const int Resolution = 100_000_000; // Generate simple sin curve. Axis Z as value copy and then we select XZ-projection. var points = new float[Resolution]; for (int i = 0; i < Resolution; i++) { points[i] = (float)Math.Sin((float)i / Resolution * Math.PI * 4); } // Data reader for series. var reader = new MyReader(0, 1, points); // Value series data presentation. var series = new Series { Reader = reader, Thickness = 1f, Name = "Series" }; // We set XZ projection for 2D mode as we use Z axis same as value, and Y axis does not has sense ChartControl.View.Camera2D.Projection = Projection2DTypes.XPosZPos; ChartControl.View.Mode2D = true; // Set chart data source. ChartControl.DataSource = series; |
|
|
Results: System memory used: 450 Mb | |
The DataReaders approach also serves data updates. Data can be updated by small segments.
Internal GPU Data Processing
The DataReaders approach enables us to avoid redundant memory allocations; and in order to continue that concept, we moved all AtomicusChart® data processing to the GPU side. That’s why we use GPU Compute as much as possible: for data bounds calculations, GPU data scaling, GPU coloring for the axis value, and so on.
Summary
The approaches described above are AtomicusChart’s® core data features. Concrete data types also have a set of interesting solutions. The AtomicusChart® development team is focused on all performance points and always tracks all memory allocations and movements. Our team already has AtomicusChart®-based solutions for data that is close to the limits of modern hardware in size.