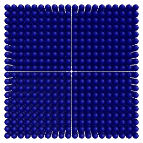
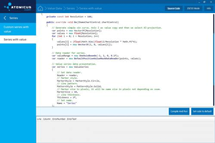
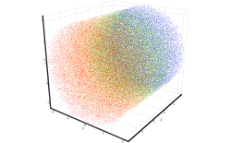
With AtomicusChart®, users can display points as an array with one color, or they can change the color using the color legend by their value axis.
Example of the Points Feature

With AtomicusChart®, users can display points as an array with one color, or they can change the color using the color legend by their value axis.