AtomicusChart® supports several scale types for more illustrative data visualization. Data can be represented on a linear, logarithmic (log), or square root (sqrt) scale, depending on the purpose of analysis. Users can apply the three types of scale to any of the axes separately, to several axes simultaneously, or to all three axes at once. The GPU-based shader program makes this possible by allowing users to quickly switch between scales.
Visualizing data on log/sqrt scales can be especially useful when data values in one data set differ by orders of magnitude. Such representation enables us to display a large range without compressing small values down to the bottom of the graph, making it easier to note important peculiarities (small peaks, noise behavior, and so on) when analyzing the data.
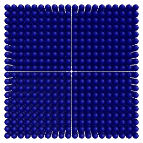
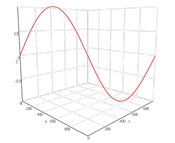
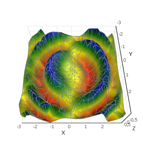
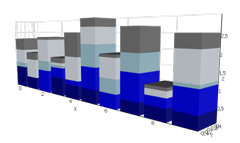
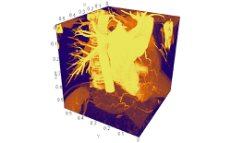
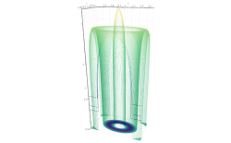
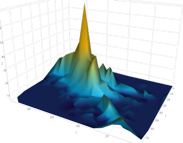
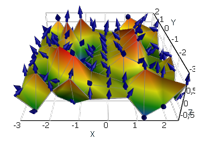
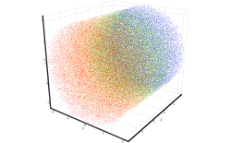
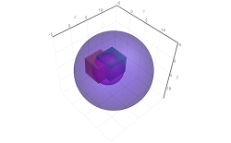
Examples of Data scaling
Log/sqrt scaling can help to establish quite simple dependencies for the analyzed data. For instance, in mass spectrometry, applying a log scale enables the user to reveal the linear (or even constant) behavior of the background. On a linear scale, the dependency is more complex. Such findings can significantly simplify further data analysis.
Applying a log scale allows us to stretch some regions of the data, which results in a more accurate analysis of the regions of interest.
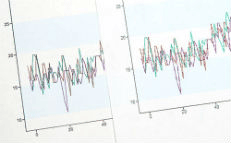
The log scale provides an essential advantage for time series data: a constant percentage change is seen as a constant vertical distance, and consequently, a constant growth rate is seen as a straight line.
| Linear scaling | Logarithmic scaling | Sqrt scaling |
|---|---|---|

|

|

|