Features


In this section, you will find detailed descriptions of the features of our AtomicusChart® library, which can be re-used and integrated in any software requiring high-speed graphics for big data visualization.

AtomicusChart® main features

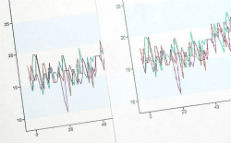
  • Data is fully stored in video memory; data processing is GPU-based.
  • The operations like switching between linear/SQRT/LOG scale, changing color map are almost instant.
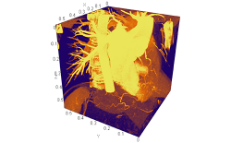
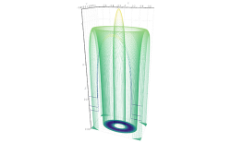
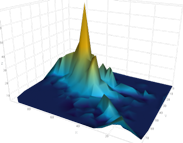
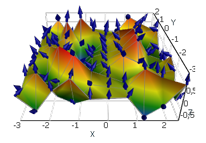
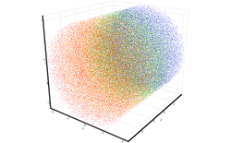
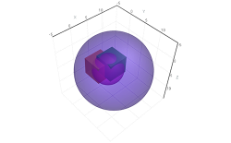
  • Visual data can be viewed in 3D or 4D as well as in 2D.
  • 24 projections are available for free.
  • The AtomicusChart® is developed to be good even on low-end video adapters.

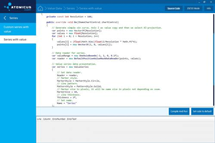
Download a free demo version with numerous functionality and code examples to learn more and evaluate all the features of our product. Our trial version contains features examples as well as commentaries and descriptions.

Large data arrays
Large data arrays
AtomicusChart® is an excellent tool for large data processing.

Series & Series 4D: display of 2D curves in 3D space like wires
Display a series of points such as curves with a rich set of visualization properties.

Surface Data Types
Surface Data Types
AtomicusChart processes a variety of surface data types and customizations for data visualization.

Common statistical graphs
Create new types of data visualization for simple data sets easily with AtomicusChart’s API.

Demo and Code Examples
Getting started with AtomicusChart.

Volume rendering
Volume rendering
AtomicusChart® provides a set of real-time GPU-based ray casting volume rendering techniques.

Data scaling
Data scaling
AtomicusChart® supports GPU-based data scaling with linear, square root, and logarithmic scales.

High resolution export
AtomicusChart® allows you to export high-resolution images.

Data Visualization Views
AtomicusChart® supports several different views for data visualization. Data can be displayed in 2D as well as 3D, with three types of spatial coordinate systems

Size in pixels
Size in pixels
AtomicusChart® allows you to align item size to pixels

Points
Points
Choose between two render techniques to draw points.

Order-independent transparency, MSAA+SSAA
AtomicusChart® supports GPU-based per pixel order-independent transparency and multisampling and supersampling antialiasing

Labels
Labels
Add labels to the lines, surfaces, and even specified points of any of the visualized objects.


We know how to help you
with large data visualization.