What Is AtomicusChart® Demo?
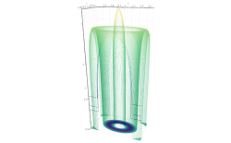
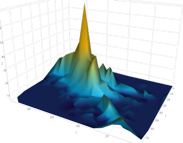
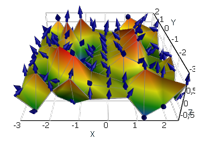
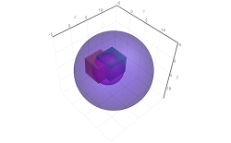
AtomicusChart® demo version was made to demonstrate the features of our component. The version is filled with a large number of original examples of functionality classified according to the type of license. The categories Basic, Value Data and Volumetric are active/inactive depending on the type of license.
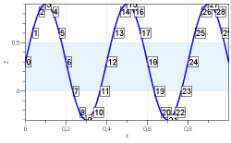
The examples have numerous settings in the user interface. You can change object properties using color legend, move objects, change view modes, estimate performance, etc. You will find the toolbar on the left, the navigation breadcrumb on the top, and the info panel on the right.


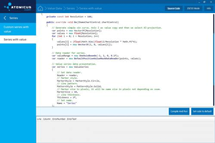
View AtomicusChart® Example Source-Code
Demo version contains an extensive number of well-documented code examples which involve a detailed description of object properties. You can modify code examples and run them right in application. Just click on Source Code in the right upper corner to view the source code of selected example and see how the feature was implemented. The source code is available as C#.

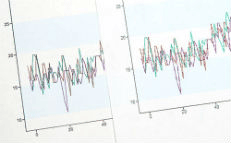
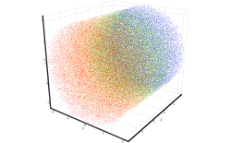
Performance Demos
We have included a separate category of dynamic data which helps you not only evaluate features, but estimate the performance of AtomicusChart when handling large data.
Where Can I Get The AtomicusChart® Demo Examples?
The AtomicusChart® demo examples are available as part of AtomicusChart® Trial, which you can download here. After a 90-day trial expires, the AtomicusChart® demo examples are still available, so you can continue to browse them.
Demo, Documentation and Code Examples
- What is included in our free trial version of AtomicusChart®?
- 90 day trial version of control panel
- AtomicusChart® demo
- How to use trial version?
- Download the installer.
- Run the setup file and install the software.
- Once the software is installed, control is added to the Visual Studio Toolbox. Drag and drop it into Form in order to start using it. screenshot