Data Visualization Views
AtomicusChart® supports several different views for data visualization. Data can be displayed in 2D as well as 3D, with three types of spatial coordinate systems and several different camera customizations. This level of specialization with features enables the user to fully modify their view to the exact specifications they require.
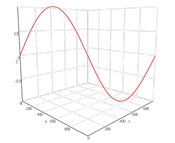
2D and 3D View
When visualizing data in 2D or 3D modes, users only need to upload their data one time. They can then switch between the two modes almost instantly, since only the camera position and lighting will change between the modes. The view in 2D uses a parallel projection of the 3D view, as well as a simplified light model, and there are some limitations for camera movement. In 2D and 3D, users can select any of the 24 available projections of the visualized object.
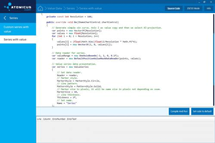
chartControl.View.Mode2D = true;
chartControl.View.Camera2D.Projection = Projection2DTypes.XZ;
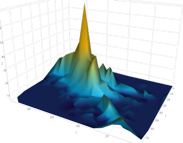
Examples of 2D/3D View


Coordinate Systems
Representing data in different coordinate systems enables more comprehensive and reliable analysis. Data visualization with AtomicusChart can be viewed in three types of spatial coordinate systems:
- Cartesian
- Cylindrical
- Spherical
Data can also be viewed in two types of planar coordinate systems — cartesian and polar.
Cartesian Coordinate Systems
The spatial cartesian system is represented by three mutually perpendicular planes with the origin at a specified point (the point of intersection of the planes). In the planar cartesian system, the position of a point is specified by two numbers, which can be used for representation of various data that depend on one variable. In this system of coordinates, the position of a point is characterized by three numbers.
Cartesian coordinates are the most natural type for data representation. However, for a number of problems, it is more convenient to use polar coordinate systems (for planar problems) or cylindrical/spherical coordinates (for spatial problems).
In spherical coordinates, the position of a point in space is defined by three numbers which are expressed through cartesian coordinates: radius r, the zenith, and the azimuth angles.
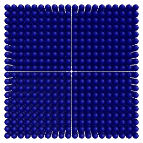
Polar Coordinate Systems
In the polar coordinate system, each point on a plane is determined by the distance from a reference point and an angle from the reference direction. Polar coordinates can be useful for analyzing objects with a radial symmetry.
The polar coordinate system can be generalized for a three-dimensional case — cylindrical coordinates. In this coordinate system, the position of a point in space is defined by three numbers, which are expressed through cartesian coordinates: the distance between the origin of the coordinates and the projection of a point onto the plane, the azimuth angle, and the projection onto the Z axis.
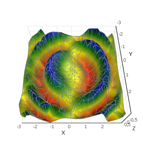
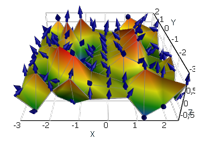
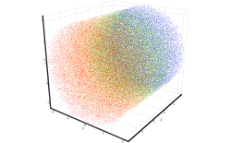
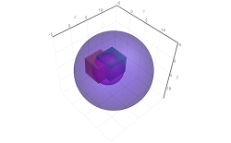
Examples of Coordinate Systems
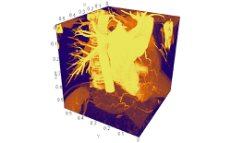
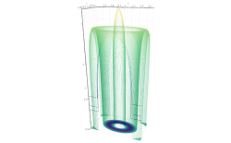
Cylindrical and spherical coordinates are useful when analyzing systems that have spherical or axial symmetry — that is, when objects have the shape of spheres, cylinders, or their parts (segments, disks, etc.). Applying these coordinates for objects with appropriate symmetry enables us to get much simpler analytical expressions and solutions.
| Cartesian in 3D view | Cylindrical in 3D view |
Spherical in 3D view |
|---|---|---|

|

|

|
| Cartesian in XZ projection | Cylindrical in XZ projection |
Spherical in XZ projection |
|---|---|---|

|

|

|
|
Cartesian in XY projection |
Cylindrical in XY projection |
Spherical in XY projection |
|---|---|---|

|

|

|
Camera Customizations
There are a few customizations for views when using AtomicusChart for data renderings:
- Aspect Ratio
- Field of View
- Padding in 2D View
- 2D Min and Max View
- Synchronization
Aspect Ratio
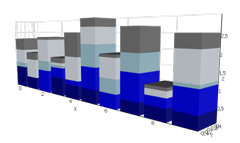
The aspect ratio is used to describe the dimensions of data by comparing the width, length, and height, and then expressing it in ratio form. This option can be applied to one or two axes only (by user specification). Users can specify the figures in which the displayed objects should be inscribed.
The data's aspect ratio can significantly affect how the information is displayed. When data is visualized with default aspect ratio settings, the proportions of the width, length, and height may differ significantly. This results in the loss of important details, as it's necessary to stretch or compress some dimensions to make the relevant features more pronounced. For instance, if the size along one axis is much larger than the size along the other, the variations of a quantity along the smaller axis may be diminished in appearance. This makes it impossible to analyze the data reliably.
chartControl.View.DefaultView3DOptions.AspectRatio = new AspectRatio(PreferableAxis.X, new Vector3<float?>(1, 1, 0.3f));
| Aspect ratio original | Aspect ratio 1 1 1 | Aspect ratio 1 1 0.3 |
|---|---|---|

|

|

|
To keep original X to Y ratio and only reduce Z axis AtomicusChart provides solution. Null value will keep original aspect ratio with preferable axis.
chartControl.View.DefaultView3DOptions.AspectRatio = new AspectRatio(PreferableAxis.X, new Vector3<float?>(1, null, 0.5f));

Field of View
Users can customize camera settings such as perspective, orthogonal view mode, user-defined data aspect ratio, camera field of view, camera position, and “look at” and “look up” mode. Users can limit the camera view using camera minimum/maximum properties and synchronize several cameras via some or all parameters.
chartControl.View.Camera3D.IsOrthogonal = false;
chartControl.View.Camera3D.FieldOfViewVertical = Math.PI / 4;
|
Perspective veiw |
Orthogonal view |
Field of view |
|---|---|---|

|

|

|
Padding in 2D View
In some cases, some free space around data area is required. This padding feature is useful when there is data on the edges or boundaries of the 2D view, so that data is overlaid or merged with view frame. AtomicusChart has options to set up this property.
//1% left padding, 20% top padding, 1% right padding, 0 bottom padding
chartControl.View.DefaultView2DOptions.DefaultViewPaddings = new CameraViewPaddings(0.01f, 0.2f, 0.01f, 0);
| No paddings | With paddings |
|---|---|

|

|
2D Min and Max View
With AtomicusChart, users have the ability to set a minimum and maximum value for each axis. By default there are no limits, but in many cases limits to data size or to some region of interest are required. If limits are set, the user will not be able to pan or zoom to area outside of these limits.
Synchronization
The view on different charts can be synchronized according to the following synchronization options:
- Synchronize X axis for 2D view
- Synchronize Y axis for 2D view
- Synchronize Z axis for 2D view
- Synchronize rotation
Axes
With AtomicusChart, views, users can fully customize the axes with both major and minor tick marks, specifying the number of ticks, tick properties (locations and labels), and tick font and color.
Users can also vary the number of minor and major ticks based on their specific needs. In some cases, it is convenient not to use any ticks at all. For example, when the user only needs qualitative information about the object, the ticks would distract from the main data. For highly structured data, users can increase the number of major and/or minor ticks to be able to more accurately estimate the quantitative characteristics of the features of interest. At the same time, for some types of data, a few major ticks will suffice. Excess ticks may make it more difficult to perceive and analyze the data.
Render Material
AtomicusChart distinguishes three basic models of object lighting: ambient, diffuse, and specular:
- Ambient: Ambient lighting is characterized by a uniform object color, which does not depend on the light source position.
- Diffuse: Diffuse lighting is the illumination that a surface receives from a light source and reflects equally in all directions. The surfaces light up in a way that looks like a matte finish.
- Specular: The specular light propagates in a preferred direction after hitting the object. Highlights are produced on the surface of the object, making it look shiny.
In order to make objects look realistic, AtomicusChart utilizes the Phong model of illumination — a mixture of ambient, diffuse and specular lighting.
The type of object lighting is of special importance for 3D objects, since it enables users to correctly assess the objects’ characteristics and understand their location in space.
AtomicusChart allows users to customize light components and illuminate sphere materials so that they look like they are made of copper, marble, or X-rays. The user can compose items of different materials and smoothly transition the intensity of the material components. Light source positions for different components can be customized as well.
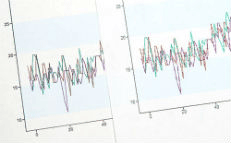
Legend
Thanks to the chart legend, you can customize the data presentation for the end user right in the runtime mode of the user interface:

Users can also customize the Color Legend, which is used to visualize the value axis. It is possible to create both smooth and sharp gradients and customize out-of-range data colors.