 Sections Sections |
 Intensities Intensities |
 Ray casting Ray casting |
 Shaded Shaded |
 Isosurfacing Isosurfacing |
 Transfer function Transfer function |
 Custom volume geometry Custom volume geometry |
 Customizations Customizations |
Volume Rendering
Volume rendering is a set of data visualization techniques used for viewing and analyzing computer graphics and scientific data. Generally, volume rendering displays 3D volumetric data sets (also called 3D scalar fields) in 2D. AtomicusChart® supports Byte, Short, and Float data formats for volume rendering. You can create custom IntensityImage3DReader projections to optimize your data storage.
A regular volumetric grid contains data that is acquired in a regular pattern, typically with a regular amount of image pixels, where each element of the grid is represented as a single value. The value is generated from a sampling of the element’s immediate surroundings. Volume elements are sometimes referred to as “voxels.”
AtomicusChart® is the state-of-the-art tool for manipulating and displaying volume data for communication and analysis.
How Volume Rendering Works
To render a 3D volumetric data sets, a couple of things must be defined:
- The virtual camera and its location relative to the volume data
- The RGB color for each voxel (using a color map)
- The opacity of each value (using a transfer function)
Volume rendering follows these steps:
- Ray Casting - A ray of sight is cast through each pixel of the volume (usually a cube).
- Sampling - Selection of sampling points along the ray of sight, which are typically in between voxels (requiring the interpolation of the sample values from surrounding voxels).
- Coloring - Selection of color from color map.
- Opacity - Apply a transfer function to adjust the opacity of each sampling point according to its intensity.
- Shading - A gradient function is used to shade and adjust the color of each sampling point according to its orientation within the volume.
- Compositing - Sampling points are composited along the ray of sight to provide the pixel’s final color value.
While most volume rendering tools require a lot of time to generate the visualization, AtomicusChart® can support large data volumes and generate renderings with very high-speed data processing.
AtomicusChart® Volume Rendering Techniques
Byte, Short, and Float data formats are supported.
We use two main techniques and several derivatives, and all techniques use GPU for processing in real time.
The datasets used as an example in this document are property of the University of North Carolina.
public static IntensityImage3DReader GetVolumeData()
{
	//Create data reader from binary file
	return new ByteIntensityImage3DReader(
		//Data bytes. 1 byte = 1 voxel.
		File.ReadAllBytes(@"myvolumetricdata.raw"),
		//Slice width
		256,
		//Slice height
		256 ,
		//Data range, here is default range as we are not interested in normalization
		new OneAxisBounds(0, 255));
}
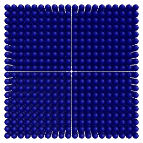
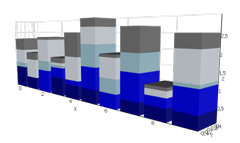
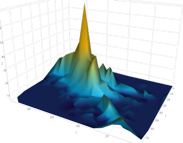
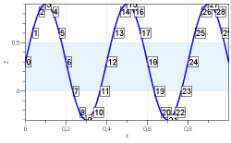
Volume Sections
The first technique is volume sections, where the user can define any level of section surface complexity. As the simplest volumetric rendering technique, volume sections follow these key steps:
- Volumetric binary data is loaded from a file, simulation, or memory
- Create data reader. Data may be stored as 2D texture slices (stacked) or a single 3D object. Using our reader approach data will be directly copied into video memory without any intermediate clones, even from c++ code using pointers.
- Creates volume section geometry (any complexity).
- Submits render data and sets the chart’s data source.
IntensityImage3DReader reader = GetVolumeData();

// This function is used for volume section geometry creation.
// We just create rectangular geometry moving it along Z axis.
VolumeGeometry GetGeometry(float relativePosition)
{
	// Generates surface positions.
	Vector3F[] positions =
	{
		new Vector3F(0.0f, 0.0f, relativePosition),
		new Vector3F(1f, 0.0f, relativePosition),
		new Vector3F(0.0f, 1f, relativePosition),
		new Vector3F(1f, 1f, relativePosition),
	};
	int[] indices = { 0, 1, 2, 2, 3, 1 };
        // We use geometry positions as volumetric texture coordinates as they are identical for volume with geometry 0..1,0..1,0..1.
	return new CustomVolumeGeometry(new VolumeMesh(positions, positions, indices));
}

VolumeSection GetSection(float relativePosition, string name)
{
	// Create volume section render data.
	return new VolumeSection
	{
		// Set section data reader.
		Reader = reader,
		// Set section geometry.
		Geometry = GetGeometry(relativePosition),
		// Set section interpolation type.
		InterpolationType = VolumeInterpolationType.Linear,
		// Set name.
		Name = name
	};
}

// Enable 3D axis.
chartControl.AxesSettings.Axes3D.IsVisible = true;

int SliceCount = 4;

// Submit render data-s.
List<RenderData> renderData = new List<RenderData>();
float sliceStep = 1.0f / (SliceCount + 1);
for (int i = 0; i < SliceCount; i++)
{
	float currentPosition = sliceStep * (i + 1);
	renderData.Add(GetSection(currentPosition, $"Section {i}"));
}
// Set chart data source.
chartControl.DataSource = renderData;


With volume sections, AtomicusChart® can also create more complex section surfaces.
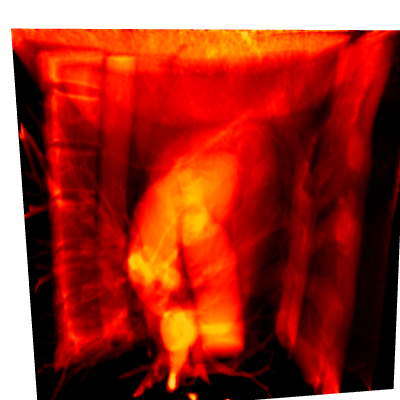
Intensity Projections
When rendering volumes using ray casting-based ray functions, we first need to determine what information we want to gather, and what data values we want to project from 3D to 2D . This will dictate the projection intensity:
- Maximum intensity projection (where the maximum density value is projected)
- Average intensity projection (where the average value is projected)
- Minimum intensity projection (possible, but almost never used)
IntensityImage3DReader reader = GetVolumeData();

var geometry = new BoxVolumeGeometry
{
	Origin = Vector3F.Zero,
	Size = new Vector3F(1f),
};

// Initialization of rendering technique.
var rayCasting = new VolumeIPRayCasting
{
	// Link to data. Several rendering techniques can use the same data. For reader we should specify link to binary data, slice size, and value axis bounds.
	// For dynamic updates of data you can implement your own reader, basic reader interface provide necessary methods for updating separate data regions.
	Reader = reader,
	// Geometry specify bounding box to that volume data will be fitted. Geometry can be more complex than just box.
	// Mostly it does not have limits, you can specify even sphere.
	Geometry = geometry,
	// Interpolation type between voxels.
	InterpolationType = VolumeInterpolationType.Linear,
	// Parameter for ray casting technique that will specify how much steps will be on a each ray.
	// Directly effects performance and render quality. By default it is calculated automatically.
	SamplingStepCount = 500,
	//We should select intensity projection type from Max, Min, Average. It also can be changed later from GUI in legend control.
	ProjectionType = VolumeIPType.Max,
	Name = "Volume"
};

// Set chart data source.
chartControl.DataSource = rayCasting;


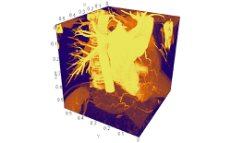
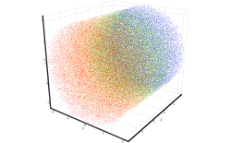
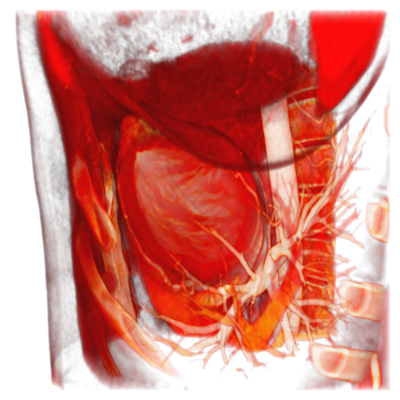
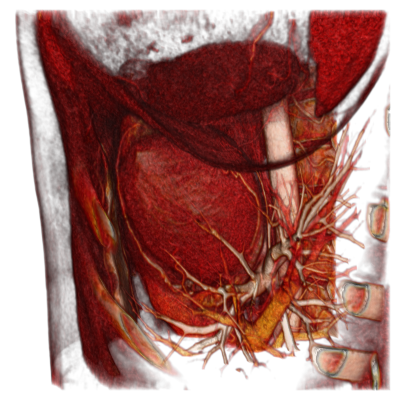
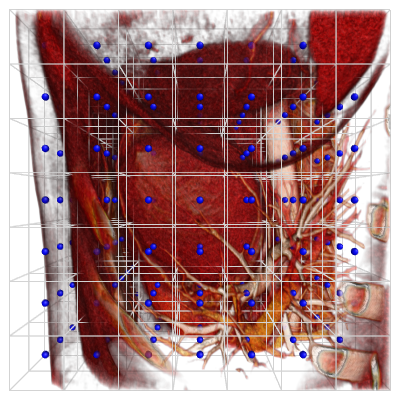
Ray Casting
Volume renderings from ray casting provide a visualization of volume data, where the data projection goes past the surface data to sample the 3D object along the axis of the ray, processing different densities and other information. As the ray traverses the volume, it samples the data inside and generates an intensity profile for each pixel.
IntensityImage3DReader reader = GetVolumeData();

var geometry = new BoxVolumeGeometry
{
	Origin = Vector3F.Zero,
	Size = new Vector3F(1f, 1f, 1f),
};

// Initialization of rendering technique.
var rayCasting = new VolumeRayCasting
{
	// Link to data. Several rendering techniques can use the same data. For reader we should specify link to binary data, slice size, and value axis bounds.
	// For dynamic updates of data you can implement your own reader, basic reader interface provide necessary methods for updating separate data regions.
	Reader = reader,
	// Geometry specify bounding box to that volume data will be fitted. Geometry can be more complex than just box.
	// Mostly it does not have limits, you can specify even sphere.
	Geometry = geometry,
	// Interpolation type between voxels.
	InterpolationType = VolumeInterpolationType.Linear,
	// Parameter for ray casting technique that will specify how much steps will be on a each ray.
	// Directly effects performance and render quality. By default it is calculated automatically.
	SamplingStepCount = 500,
	// Threshold for transparent areas that will no be visible for hit testing.
	// 0 will increase picking performance due to item will be picked by bounding box.
	HitTestThreshold = 0.25f,
	// Global value transparency scale.
	ValueScale = 0.5f,
	// Set name.
	Name = "Volume",
};

chartControl.Multisampling = Multisampling.Off;

// Set chart data source.
chartControl.DataSource = rayCasting;

The same but with shading:
IntensityImage3DReader reader = GetVolumeData();

var geometry = new BoxVolumeGeometry
{
	Origin = Vector3F.Zero,
	Size = new Vector3F(1f, 1f, 1f),
};

// Initialization of rendering technique.
var rayCasting = new VolumeShadedRayCasting
{
	// Link to data. Several rendering techniques can use the same data. For reader we should specify link to binary data, slice size, and value axis bounds.
	// For dynamic updates of data you can implement your own reader, basic reader interface provide necessary methods for updating separate data regions.
	Reader = reader,
	// Geometry specify bounding box to that volume data will be fitted. Geometry can be more complex than just box.
	// Mostly it does not have limits, you can specify even sphere.
	Geometry = geometry,
	// Interpolation type between voxels.
	InterpolationType = VolumeInterpolationType.Linear,
	// Parameter for ray casting technique that will specify how much steps will be on a each ray.
	// Directly effects performance and render quality. By default it is calculated automatically.
	SamplingStepCount = 800,
	// Threshold for transparent areas that will no be visible for hit testing.
	// 0 will increase picking performance due to item will be picked by bounding box.
	HitTestThreshold = 0.25f,
	// Global value transparency scale.
	ValueScale = 0.5f,
	// Set name.
	Name = "Volume",
	//Material that would be used for light
	Material = new RenderMaterial(0.2f, 0.8f, 0.5f, 0, 0)
};

// Decrease multisampling level to improve interaction experience.
chartControl.Multisampling = Multisampling.Off;

// Set chart data source.
chartControl.DataSource = rayCasting;

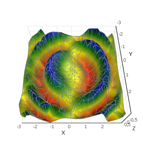
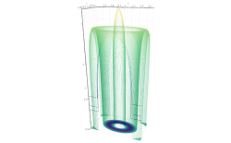
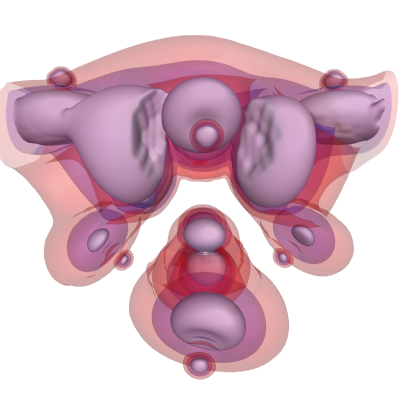
Isosurfacing
Isosurfacing is one of the ray casting based techniques used in AtomicusChart®. We are able to visualize several isolevels with transparency on the same graph using our unique order-independent transparency feature.
IntensityImage3DReader reader = GetVolumeData();

var geometry = new BoxVolumeGeometry
{
	Origin = Vector3F.Zero,
	Size = new Vector3F(1f),
};

var isoSurfacing1 = new VolumeIsoRayCasting
{
	Reader = reader,
	IsoValue = 20,
	SamplingStepCount = 500,
	Color = new Color4(255,0, 0, 50),
	IsDepthTestEnabled = true,
	Geometry = geometry,
};
var isoSurfacing2 = new VolumeIsoRayCasting
{
	Reader = reader,
	IsoValue = 50,
	Color = new Color4(0, 0, 255, 50),
	SamplingStepCount = 500,
	IsDepthTestEnabled = true,
	Geometry = geometry,
};
var isoSurfacing3 = new VolumeIsoRayCasting
{
	Reader = reader,
	IsoValue = 100,
	Color = new Color4(255, 255, 255, 255),
	SamplingStepCount = 500,
	IsDepthTestEnabled = true,
	Geometry = geometry,
};

// Decrease multisampling level to improve interaction experience.
chartControl.Multisampling = Multisampling.Low2X;

chartControl.IsOitEnabled = true;

// Set chart data source.
chartControl.DataSource = new RenderData[] { isoSurfacing3, isoSurfacing2, isoSurfacing1 };

AtomicusChart® Volume Rendering Customizations
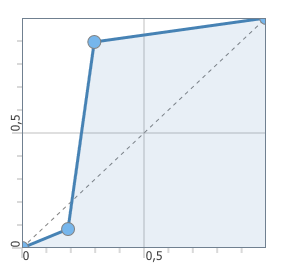
Transfer Function
The user is able to apply a predefined transfer function or a function that consists of an intermediate point array that can be edited through GUI, and values are linearly interpolated between the ones closest to them. GUI for editing transfer function can be shown by clicking the item icon in the AtomicusChart® legend.
One of the most notable advantages of customizable transfer function (which some volume rendering techniques support) is that you can use the opacity values to see the interior of the data volume instead of discarding the interior information. Therefore, you can view the 3D data set as a complete whole.
By setting almost opaque values for mapping the corresponding data and setting the rest as transparent, users can show isosurfaces.
/// <inheritdoc />
/// <summary>
/// Base type for transfer function 1D.
/// </summary>
public abstract class TransferFunction1D : BaseNotifyProperty
{
	/// <summary>
	/// Gets intermediate points.
	/// </summary>
	public event EventHandler Changed;

	/// <summary>
	/// Sample transfer function.
	/// </summary>
	/// <param name="value">Sample value.</param>
	/// <returns>Result.</returns>
	public abstract float SampleLinear(float value);

	/// <summary>
	/// Creates clone of the function.
	/// </summary>
	/// <returns>Result of cloning.</returns>
	public abstract TransferFunction1D Clone();

	/// <summary>
	/// Raise changed event.
	/// </summary>
	protected void OnChanged() => Changed?.Invoke(this, EventArgs.Empty);
}


Color Mapping
Color mapping is also an option (except with isosurfacing), and can be easily customized from both GUI and code.
var colorMap = new AtomicusChart.Interface.Data.ColorMap
{
	Bottom = AtomicusChart.Interface.Data.Colors.Black,
	Top = AtomicusChart.Interface.Data.Colors.White
};
colorMap.ColorStops.Clear();
colorMap.ColorStops.Add(new ColorStop(new Color4(115, 35, 8), 0.227f * legendScale));
colorMap.ColorStops.Add(new ColorStop(new Color4(211, 2, 0), 0.275f * legendScale));
colorMap.ColorStops.Add(new ColorStop(new Color4(252, 178, 0), 0.3f * legendScale));
colorMap.ColorStops.Add(new ColorStop(new Color4(221, 217, 194), 0.35f * legendScale));
colorMap.ColorStops.Add(new ColorStop(new Color4(249, 248, 242), 0.4f * legendScale));

chartControl.ColorMap = colorMap;

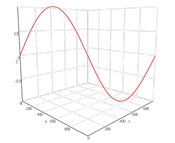
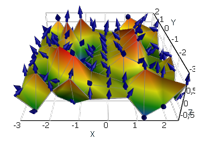
Volume geometry and sections
Chart supports different geometries for ray casting and section techniques. The next steps to create custom geometry are to:
- Define geometrical points
- Define texture coordinates for each geometrical point (relative volumetric data coordinates from 0 to 1 per axis)
- Define triangle indexes list to create a surface from points
Using such a flexible approach, it is a very easy task to create custom volume sections and volume clippings while skipping empty spaces. The geometry update is performed independently of volumetric data set update, and this property can be changed at any time and is a very fast operation.
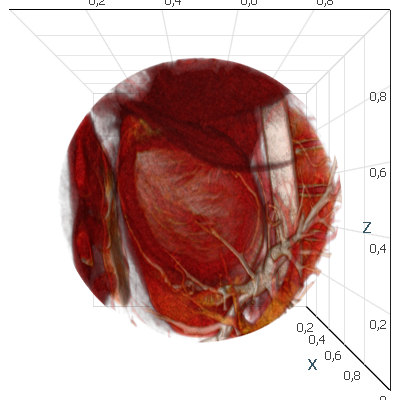
Below is an example of spherical geometry for ray casting.
// Very simple sphere generation algorithm.
const int resolution = 50;

const float r = 0.5f;
var center = new Vector3F(0.5f);
var vertex = new Vector3F[resolution * resolution];

int index = 0;
for (var i = 0; i < resolution;i++)
{
	// We use here inversed order due to triangle list indexes generation algorithm.
	// It is very important to use correct counterclockwise triangle indexes generation for ray casting.
	for (int k = resolution - 1; k >= 0; k--)
	{
		var t = Math.PI * i / (resolution - 1);
		var f = Math.PI * 2 * k / (resolution - 1);
		vertex[index++] = new Vector3F((float)(r * Math.Sin(t) * Math.Cos(f)), (float)(r * Math.Sin(t) * Math.Sin(f)),
								(float)(r * Math.Cos(t))) + center;
	}
}

// Section geometry.
var complexGeometry = new CustomVolumeGeometry(new VolumeMesh(vertex, vertex,
	GridHelper.GetStructuredTriangleListIndices(0, resolution, resolution, 1)));
Using custom geometry, we can also create volume clippings:
var vertexes = new []
{
	new Vector3F(0.5f, 0, 0),new Vector3F(1, 0, 0),new Vector3F(0.5f, 1, 0),new Vector3F(1, 1, 0),
	new Vector3F(0.5f, 0, 1),new Vector3F(1, 0, 1),new Vector3F(0.5f, 1, 1),new Vector3F(1, 1, 1),
};
var indexes = new []
{
	0, 1, 2, 2, 1, 3,
	1, 5, 3, 3, 5, 7,
	4, 0, 2, 4, 2, 6,
	4, 6, 5, 5, 6, 7,
	6, 2, 3, 7, 6, 3,
	4, 5, 0, 0, 5, 1
};
var geom = new CustomVolumeGeometry(new VolumeMesh(vertexes, vertexes, indexes));

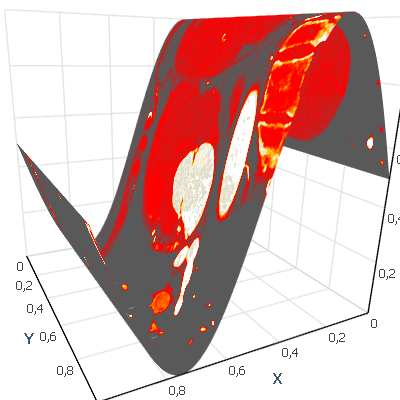
And the same approach used for section:
private void InitSinTexutes()
{
	IntensityImage3DReader reader = GetVolumeData();

	// This function is used for volume section geometry creation.
	VolumeGeometry GetGeometry()
	{
		const int res = 100;

		var positions = new Vector3F[res * 2];
		// Generates surface positions.
		for (int i = 0; i < res; i++)
		{
			var x = (float) i / (res - 1);
			positions[i * 2] = new Vector3F(x,0, (float)Math.Sin(x * Math.PI*2)/2f + 0.5f);
			positions[i * 2 + 1] = new Vector3F(x,1, (float)Math.Sin(x * Math.PI*2) / 2f + 0.5f);
		}
		return new CustomVolumeGeometry(new VolumeMesh(positions, positions, GridHelper.GetStructuredTriangleListIndices(0, 2, res, 1)));
	}

	// Enable 3D axis.
	chartControl.AxesSettings.Axes3D.IsVisible = true;

	var renderData = new VolumeSection
	{
		// Set section data reader.
		Reader = reader,
		// Set section geometry.
		Geometry = GetGeometry(),
		// Set section interpolation type.
		InterpolationType = VolumeInterpolationType.Linear,
		// Set name.
		Name = "Custom section"
	};

	// Set chart data source.
	chartControl.DataSource = renderData;
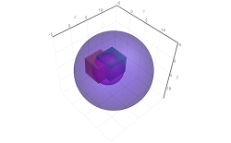
Objects Inside Volume
When performing ray casting in AtomicusChart®, users can take advantage of a special flag called “IsDepthTestEnabled = true” to render an object inside the volumetric data. Objects inside volume renderings are displayed accurately with our module, while other charts ignore interior objects.
Sampling count
The user is able to change the number of samples inside volumetric data for ray. A higher number increases quality, yet reduces performance.
// Parameter for ray casting technique that will specify how much steps will be on a each ray.
// Directly effects performance and render quality. By default it is calculated automatically.
SamplingStepCount = 1000,


Sampling interpolation quality
We offer None, Linear and Cubic interpolation types. Cubic sampling helps to avoid artifacts for low resolution data sets


Multisampling antialiasing
Also referred to as Multisampling Antialiasing (MSAA), Multisampling is another global chart option that can be applied to volume rendering with AtomicusChart®. However, while it increases the volume rendering quality, it also reduces performance. In many other software options, multisampling anti-aliasing does not affect volume rendering, but it does in AtomicusChart®. Ray casting is performed for each sampled pixel and as a result, MSAA 8x requires 8x more time to render an image(depending on hardware).


Single Memory Approach
This approach involves IntensityImage3DReader in order to use the same video memory buffer for volumetric data inside one application, even if they are displayed in different chart controls. Essentially, a single volume can be displayed in different windows with different visualization techniques, and only one memory buffer will be used for all of them. See more on our Large Data Arrays page.