 Concept Concept |
 Examples Examples |
 Use cases Use cases |
Size in Pixels With AtomicusChart®
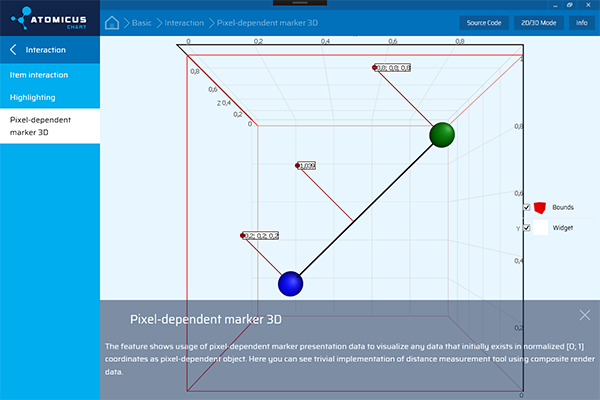
Visualizing data can be problematic when you’re required to draw items related to the pixel size and not to the scene itself. This can be especially useful when you need to draw some additional information around a point or enable item interaction with your mouse or touchscreen. It’s convenient when the size of such items (in pixels) is constant, independent of zoom, projection, perspective distortion, and other factors.
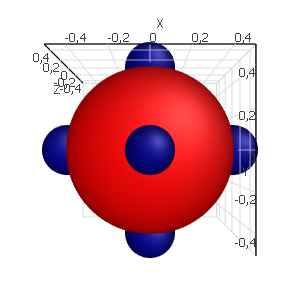
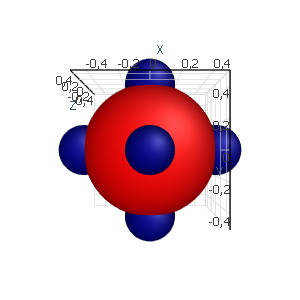
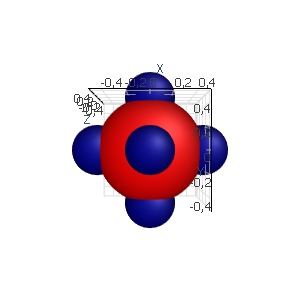
AtomicusChart® offers a very simple solution to this problem with markers. Users only have to wrap the data into a marker type. Below is a basic example of marker usage:
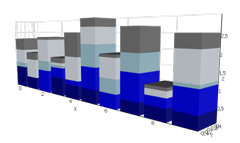
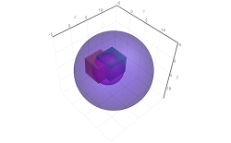
//Generate marker positions
var positions = new[]
{
	new Vector3F(0, 0, 0.5f), new Vector3F(0, 0.5f, 0), new Vector3F(0.5f, 0, 0),
	new Vector3F(0, 0, -0.5f), new Vector3F(0, -0.5f, 0), new Vector3F(-0.5f, 0, 0)
};

//Convert positions to markers
var markers = positions.Select(p =>
	new Marker(new Sphere { Color = Colors.DarkBlue })
	{
		Transform = Matrix4F.Translation(p),
		PixelSize = 50
	});

//simple sphere to compare sizes
var sphere = new Sphere();

var data = new List<RenderData>();
data.Add(sphere);
data.AddRange(markers);

ChartControl.DataSource = data;
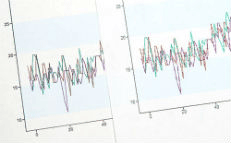
This is the result of using different zoom options:
Examples of the Size in Pixels Feature
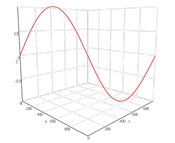
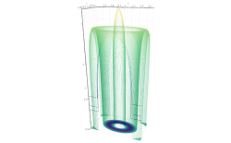
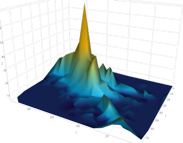
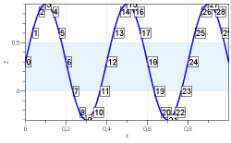
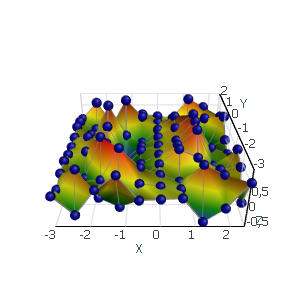
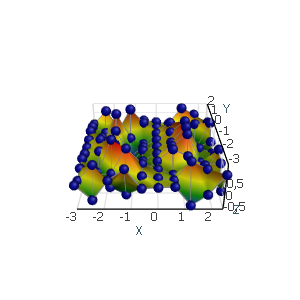
When users need to display specified points of measurement on the surface, they can do so in the following way:
const int size = 10;
var data = new List<RenderData>();
var positions = DemoHelper.GenerateSinPoints(size);

//Convert positions to markers
var markers = positions.Select(p =>
	new Marker(new Sphere { Color = Colors.DarkBlue })
	{
		Transform = Matrix4F.Translation(p),
		PixelSize = 10
	});

// Data presentation in the form of surfaces.
var surface = new ValueSurface
{
	// Data reader approach is used to improve performance for big data sets and their updates.
	Reader = new StructuredValueSurfaceDataReader(
		positions, // Surface positions.
		DemoHelper.ExtractZValues(positions, out OneAxisBounds valueBounds),
		size, // Width and height are required for triangulation of structured grid.
		size,
		valueBounds), //Bounds of value axes.
						// Set presentation option.
	PresentationType = ValueSurfacePresentationType.SolidAndWireframe,
	// Set name.
	Name = "Surface"
};

data.Add(surface);
data.AddRange(markers);
ChartControl.DataSource = data;
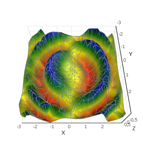
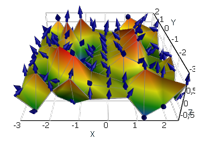
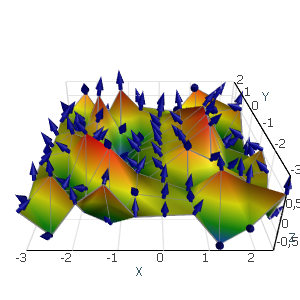
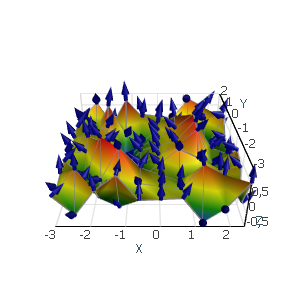
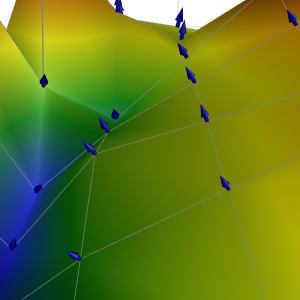
Additionally, AtomicusChart® allows users to easily display normal orientations for each vertex:
const int size = 10;
var data = new List<RenderData>();
var positions = DemoHelper.GenerateSinPoints(size);

var normals = NormalProcessor.GetSmoothNormals(positions, GridHelper.GetStructuredTriangleListIndices(0, size, size, 1));
for (int i = 0; i < positions.Length; i++)
{
	data.Add(
		new Marker(new Arrow
		{
			Color = Colors.DarkBlue,
			Direction = normals[i],
			Radius = 0.2f
		})
		{
			Transform = Matrix4F.Translation(positions[i]),
			PixelSize = 20
		});
}
// Data presentation in the form of surfaces.
var surface = new ValueSurface
{
	// Data reader approach is used to improve performance for big data sets and their updates.
	Reader = new StructuredValueSurfaceDataReader(
		positions, // Surface positions.
		DemoHelper.ExtractZValues(positions, out OneAxisBounds valueBounds),
		size, // Width and height are required for triangulation of structured grid.
		size,
		valueBounds), //Bounds of value axes.
	// Set presentation option.
	PresentationType = ValueSurfacePresentationType.SolidAndWireframe,
	// Set name.
	Name = "Surface"
};

data.Add(surface);
ChartControl.DataSource = data;
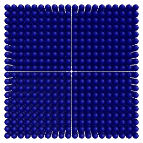
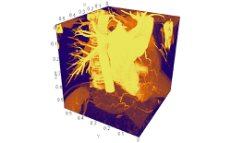
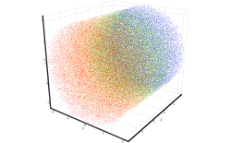
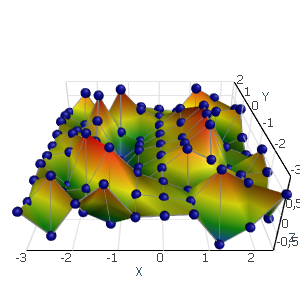
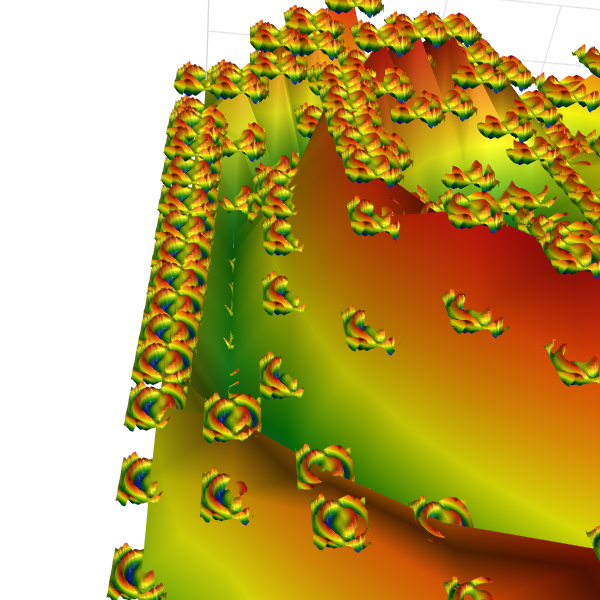
AtomicusChart® can display anything as a marker object. In the example below, the data itself is displayed as marker objects:
const int size = 20;
var data = new List<RenderData>();
var positions = DemoHelper.GenerateSinPoints(size);
// Data presentation in the form of surfaces.
var surface = new ValueSurface
{
	// Data reader approach is used to improve performance for big data sets and their updates.
	Reader = new StructuredValueSurfaceDataReader(
		positions, // Surface positions.
		DemoHelper.ExtractZValues(positions, out OneAxisBounds valueBounds),
		size, // Width and height are required for triangulation of structured grid.
		size,
		valueBounds), //Bounds of value axes.
	// Set presentation option.
	PresentationType = ValueSurfacePresentationType.Solid,
	// Set name.
	Name = "Surface"
};

var markers = positions.Select(p =>
	new Marker(surface)
	{
		Transform = Matrix4F.Translation(p),
		PixelSize = 10
	});


data.Add(surface);
data.AddRange(markers);

ChartControl.DataSource = data;
Uses
Different interactive AtomicusChart® tools are based on the markers data type. The markers do not override the data when users zoom in or out, and they’re always large enough for users to interact with them using a mouse or touchpad.