Labels With AtomicusChart®
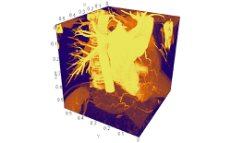
Users can utilize labels to describe any of the visualized objects, including both global objects (lines, surfaces, etc.) and local objects (a specified point of a 2D/3D object, etc.). They can also customize the labels to a high degree, specifying the font size and color, the size and color of the bounding box, the background color, and the color and radius of the label's marker.
Choose to display labels either vertically or horizontally. When an object is rotated, the label moves with the object but is always facing the user, so required information is always at hand.
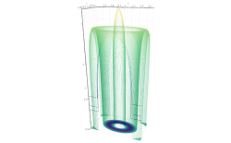
The labels for the object as a whole and for local objects can be displayed or hidden independently of one another.
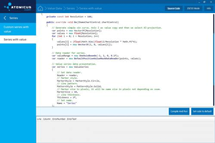
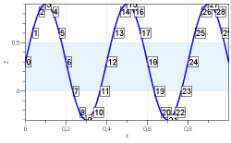
Example of the Labels Feature
After creating a label, the user can include any information inside it: a description of the object, point coordinates, and so on.